

Macro Snapshot: Two events defined the week ending June 12. On Monday June 9, White House officials indicated that US-Iran nuclear negotiations were making positive progress; oil prices dropped immediately, with WTI crude falling approximately 4% to $87.61 and Brent losing 3.5% to $90.92. Then on Tuesday June 10, the Bureau of Labor Statistics released the May CPI: headline inflation accelerated to 4.2% year-on-year, the highest reading since April 2023, up from 3.8% in April. The monthly increase was 0.5%, driven overwhelmingly by energy, which rose 23.5% year-on-year and accounted for over 60% of the headline increase. Core CPI, however, came in at 2.9% year-on-year with a monthly rise of only 0.2%, below April’s 0.4%.
The split between hot headline and soft core created a complicated signal. The headline number reinforced the inflation persistence narrative and tightened the case for rate hikes; the soft core suggested the inflation is almost entirely energy-driven, a function of the Iran conflict rather than broad demand pressure. Gold flash-crashed to $4,027 intraday on June 10, a multi-month low and more than 25% below its January 28 all-time high of $5,589. It recovered to close the week at $4,238.8, but the damage to the chart and to sentiment was visible: several investment banks cut their gold price forecasts during the week, with Citigroup lowering its three-month target to $4,000 and JPMorgan reducing its 2026 average to $5,243. Goldman Sachs maintained its $5,400 year-end call, citing sustained central bank demand.
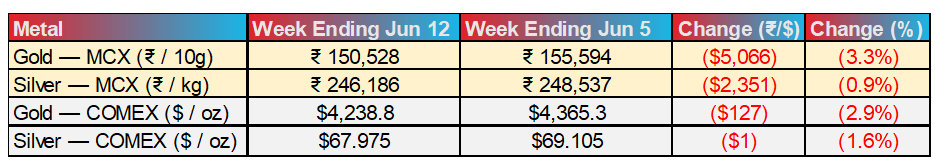
The rupee traded in a narrow band through the week, weakening from approximately 95.64 on Monday to 95.88 by Wednesday before firming to approximately 95.11 by Friday. The net weekly move was modest, but the direction was meaningful: the rupee was weaker at the point of maximum gold stress (the CPI day), which meant that MCX gold’s domestic decline (3.3%) exceeded COMEX’s dollar decline (2.9%). The cushion that had protected Indian gold holders through the previous three weeks reversed. The FOMC meeting on June 16-17, Kevin Warsh’s first as Chair, is now days away. Markets are pricing a 97% probability of a hold, but the new dot plot will be the first forward-rate signal under Warsh’s leadership.
Gold-specific drivers. The geopolitical premium that had been embedded in gold since the February 28 US-Iran conflict is now being actively priced out. The Iran peace signals on June 9 removed a meaningful portion of the safe-haven bid that had sustained gold through the spring. At the same time, the CPI print pushed rate-hike probabilities higher; CME FedWatch now shows approximately 70% odds of at least one hike by December. Gold is caught between two compressing forces: the geopolitical floor is rising (as peace signals grow) and the rate ceiling is falling (as hike expectations firm). The WGC central bank buying data from April (17 tonnes net) remains the structural support story, but it is being overwhelmed on a short-term horizon by the rate and risk-premium repricing. For Indian holders, the rupee reversal is the new variable. The May 13 duty hike created a domestic discount of $145-150/oz that had been insulating MCX prices. That insulation failed for the first time in the week ending June 12.
Silver-specific drivers. Silver’s relative behaviour inverted from the prior week. In the week ending June 5, MCX silver underperformed COMEX (6.9% vs 8.9%); in the week ending June 12, MCX silver outperformed COMEX (0.9% vs 1.6%). The rupee dynamics that hurt gold helped silver, and silver’s decline on COMEX was itself more modest than gold’s. The gold-silver ratio, which had widened sharply to approximately 63.9 on June 10, is now the highest reading of 2026, up from 55 in early May. That widening reflects silver’s continued sensitivity to rate expectations on the monetary side, even as the industrial deficit story (46.3 Moz for 2026 per the World Silver Survey) remains structurally intact. Solar PV thrifting at current price levels continues to shift the deficit’s composition toward retail investment and financial demand, but the deficit itself persists.
Gold | MCX GOLD1!
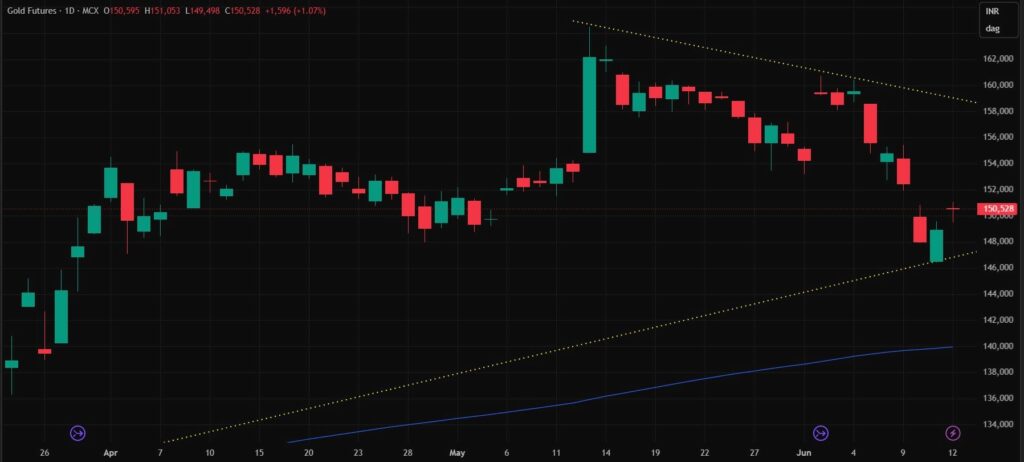
The 1,52,000 to 1,54,000 demand shelf that had been flagged in the prior week’s note as the structural line to watch has broken. Price flushed through that zone and extended to the 1,47,000 to 1,48,000 area before producing a reaction bounce back toward 1,50,500. The latest candle is green but modest; the bounce is reacting from the lower rising trendline (visible on the chart as the ascending yellow dotted line), not from a confirmed demand reclaim.
The recovery has not reclaimed the broken 1,52,000 to 1,54,000 zone. Until it does, that former support functions as near-term resistance. The 1,58,500 to 1,60,000 supply area remains well above and untested. The lower-high sequence from the mid-May spike continues, and the current bounce reads as corrective stabilisation near demand rather than a structural reversal. Confirmation of a reversal would require acceptance back above 1,52,000 to 1,54,000; confirmation of further downside would come from a failure of the rising trendline support and a close below 1,47,000.
The domestic picture matters here. MCX gold’s 3.3% decline exceeded COMEX’s 2.9%, meaning the rupee added to the loss rather than cushioning it. The May 13 duty-discount insulation has not vanished, but its effectiveness is no longer guaranteed on a week-to-week basis. Indian holders who had been sheltered by the rupee-and-duty mechanic are now exposed to the possibility that domestic and international moves can compound rather than offset.
| Key Takeaway: Gold has a confirmed breakdown below ₹1,52,000 to ₹1,54,000, followed by a reaction bounce from the rising trendline near ₹1,47,000 to ₹1,48,000. The bounce is corrective, not structural. Direction remains bearish below ₹1,52,000 to ₹1,54,000. For Indian market participants, the rupee cushion reversed for the first time since the May 13 duty hike: MCX gold fell more than COMEX gold in the week ending June 12. The insulation that had been a defining feature of the post-duty-hike market is no longer reliable on a short-term basis. |
Silver | MCX SILVER1!
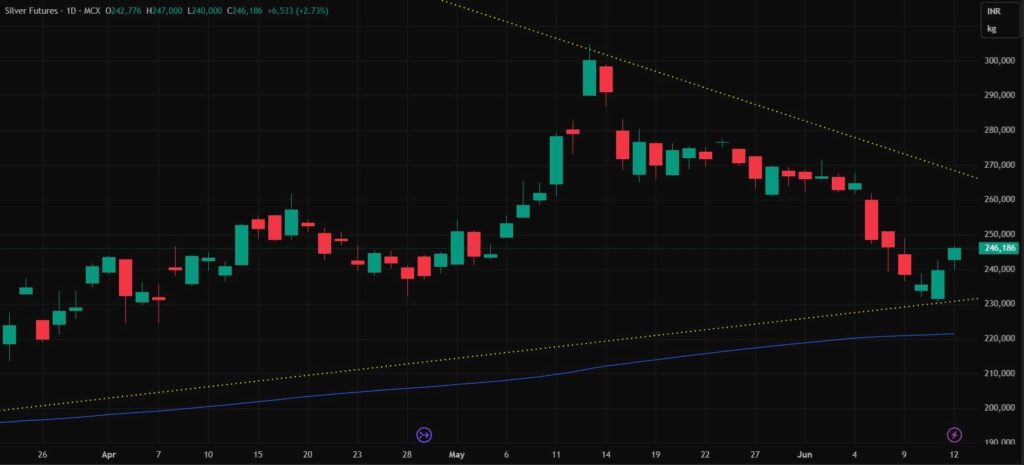
Silver dropped sharply below 2,60,000 earlier in the period, extending into the 2,32,000 to 2,36,000 demand area before producing a more visible bounce than gold. The recovery has carried price back toward 2,46,000, but this is still below the broken 2,48,000 to 2,50,000 zone and well below the more significant 2,60,000 to 2,65,000 supply area that was confirmed as resistance in the prior week.
The latest green candles show a reaction from lower demand, not a confirmed reversal. The upper descending trendline continues to cap the broader structure, while the lower rising trendline has produced the current rebound. Price is compressing between falling supply and rising demand, but the internal structure remains damaged. The May spike above 2,90,000 failed completely, and the following sequence has formed lower highs and lower lows. The current bounce challenges near-term breakdown resistance at 2,48,000 to 2,50,000.
Silver’s relative MCX outperformance (0.9% decline vs COMEX’s 1.6%) is the mirror image of gold’s underperformance. The rupee dynamic that hurt gold helped silver, and silver’s smaller absolute COMEX decline reflects a market that has already absorbed much of the rate-hike repricing over the prior two weeks. The gold-silver ratio at approximately 63.9, the widest of 2026, suggests that silver has cheapened considerably relative to gold; whether that represents an opportunity or a warning depends entirely on whether the industrial deficit story can reassert itself against the rate-cycle headwind.
| Key Takeaway: Silver remains in a confirmed breakdown after losing ₹2,60,000 to ₹2,65,000, but is showing a more visible reaction bounce than gold from lower demand near ₹2,32,000 to ₹2,36,000. The bounce challenges ₹2,48,000 to ₹2,50,000 resistance. Structure stays bearish below ₹2,60,000 to ₹2,65,000. The gold-silver ratio at approximately 63.9, the widest of 2026, is a measure of how far silver has cheapened relative to gold. For trade participants, silver’s MCX outperformance in the week ending June 12 (0.9% vs COMEX’s 1.6%) is a reversal from the prior week’s pattern, but it does not yet constitute a structural change. |
Watch in the Days Ahead:
- FOMC June 16-17 and the dot plot: The rate decision is settled (97% probability of hold). The dot plot is not. This is Kevin Warsh’s first meeting as Chair, and the forward-rate projections will be the first signal of how his committee views the path from here. Any material shift in median dots toward a 2026 hike would extend pressure on gold and silver. A dovish surprise, particularly one that frames the CPI as energy-driven and temporary, would be a significant positive catalyst for both metals.
- Iran peace deal trajectory: The June 9 signals marked a meaningful shift in geopolitical risk pricing. Oil fell sharply and the gold safe-haven bid weakened. If a formal agreement or extended ceasefire emerges, the energy component of CPI collapses, the rate-hike case softens, and two of gold’s current headwinds reverse simultaneously. If talks break down, the opposite occurs.
- Rupee direction and the cushion question: The week ending June 12 showed that the duty-and-rupee insulation can work in both directions. The rupee’s behaviour around the FOMC announcement and any FII flow response to the recent G-Sec tax relief will determine whether MCX gold reverts to its cushioned mode or continues to amplify international moves.
- Gold at the rising trendline: MCX gold is reacting from the rising trendline that has supported the broader structure since February. A hold here keeps the larger compression alive; a break below ₹1,47,000 on a closing basis would be a more significant structural failure than the ₹1,52,000 to ₹1,54,000 break that occurred in the week ending June 12.
- Silver at ₹2,48,000 to ₹2,50,000: This level is the near-term decision point. Acceptance above it reopens the path to test ₹2,60,000 to ₹2,65,000 (the confirmed breakdown level). Rejection here sends price back toward ₹2,32,000 to ₹2,36,000.
Disclaimer: This article is for informational purposes only and does not constitute investment or trading advice. All prices are futures closing prices, MCX in INR, COMEX in USD. Past performance is not indicative of future results.
Authored by Dhawal Chotai
