

Macro Snapshot: This week (ending April 17, 2026) was defined by a volatile, whipsaw geopolitical narrative around the Strait of Hormuz. On Friday April 17, Iran announced that commercial vessels could transit the strait freely during the Lebanon ceasefire truce, sending oil prices down more than 10% and sparking a relief rally in equities. Gold and silver initially dipped on the news before recovering as Iran reversed course the same evening, reinstating strict control of the strait and tying any reopening to a full US lifting of its naval blockade of Iranian ports. The ceasefire itself expires this coming week with no comprehensive deal in sight.
Gold & Silver Weekly: Triangle Compression, a Fragile Ceasefire, and the FOMC Clock Ticking
| Metal | This Week (Apr 17) | Last Week (Apr 10) | Change (₹/$) | Change (%) |
| Gold — MCX (₹ per 10g) | ₹1,54,609 | ₹1,52,652 | +₹1,957 | +1.3% |
| Silver — MCX (₹ per kg) | ₹2,57,142 | ₹2,43,274 | +₹13,868 | +5.7% |
| Gold — COMEX ($ per oz) | $4,868 | $4,780 | +$88 | +1.8% |
| Silver — COMEX ($ per oz) | $82.52 | $78.79 | +$3.73 | +4.7% |
Note: COMEX prices are spot prices in USD/oz. MCX prices are futures closing prices in INR. Grey rows are international reference prices; coloured rows are domestic MCX prices relevant for Indian trade.
The inflation-versus-yields tension that has framed this entire rally remains unresolved. The next FOMC meeting is April 28-29, with markets pricing near-certainty of a hold at 3.50-3.75%. The real risk is a hawkish hold — where Powell’s tone pushes US 10-year Treasury yields higher — which would be a headwind for non-yielding precious metals. With March CPI already at 3.3% and energy prices up 12.5% year-on-year, the Fed has little room to sound dovish. Gold and silver are navigating this tension through safe-haven demand, which is currently strong enough to offset the yield pressure, but only just.
For India, the rupee’s weakness against the dollar continues to act as a price amplifier. MCX gold’s 1.3% weekly gain in INR terms compares to COMEX gold’s 1.8% gain in USD terms — the difference reflects modest rupee strengthening this week. When the rupee weakens again, as it may under sustained oil import pressure, domestic MCX prices will outpace COMEX moves.
Gold | MCX GOLD1!
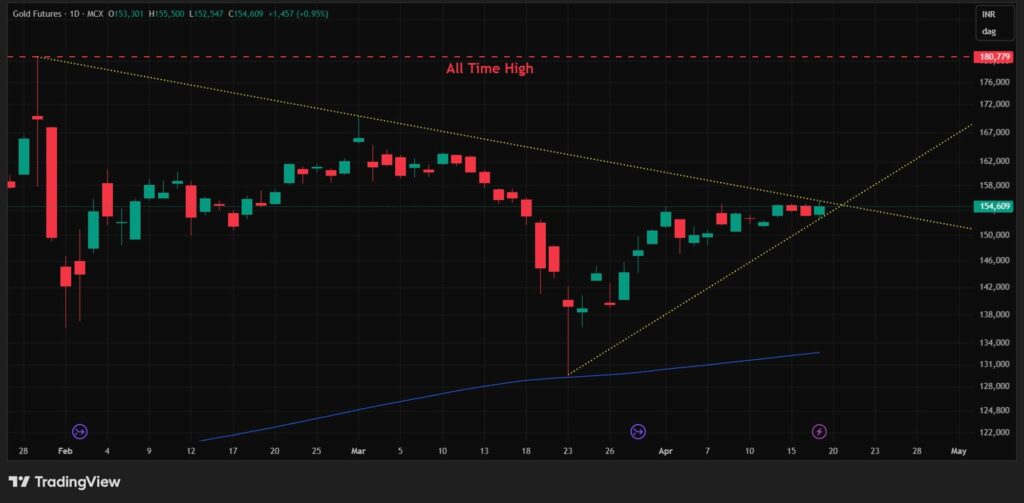
The chart tells a cleaner story than last week’s price action alone suggests. After the sharp selloff from the January ATH of ₹1,80,779 all the way to correction lows around ₹1,37,000-38,000 in late March — a drawdown of roughly 24% — gold has been tracing a series of higher lows in the recovery. That rising support trendline, visible from the late-March base, is now converging with a falling resistance trendline drawn from the ATH. The result is a classic symmetrical triangle compression pattern.
This week’s price action — modest gains but sideways drift in the final sessions — is consistent with a market approaching the apex of that triangle. Gold at ₹1,54,609 is sitting roughly 14.5% below its ATH and approximately 17.5% above its 200 EMA. Both numbers confirm the broader uptrend is intact, but the triangle structure is signalling that a directional move — breakout or breakdown — is close. The direction of that move will likely be determined by the FOMC meeting and Hormuz developments over the next 10 days.
Key Takeaway: Gold is compressing inside a triangle just below falling resistance. Jewellers and trade participants should note that this is a decision zone — price could break higher toward ₹1,60,000-plus or pull back toward ₹1,48,000-50,000 on a hawkish Fed or ceasefire breakthrough. The structure does not favour large uncommitted positions in either direction. For procurement, the ₹1,50,000-52,000 zone has shown itself as solid support over the past two weeks.
Silver | MCX SILVER1!
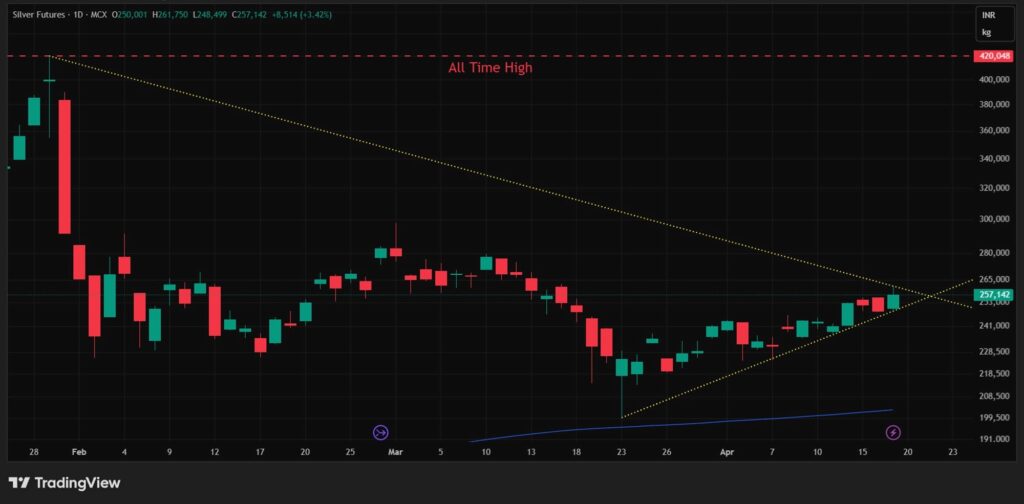
MCX Close (Apr 17): ₹2,57,142 per kg Prior week (Apr 10): ₹2,43,274 Change: +₹13,868 (+5.7%) | ATH: ₹4,20,048 200 EMA: ~₹2,00,468
Silver’s chart shows the same triangle structure as gold, but with a key difference: silver is pressing more actively against the falling resistance line rather than simply drifting into the apex. This week’s 5.7% gain — nearly 4.5 times gold’s 1.3% move — reflects silver’s dual nature as both a safe-haven asset and an industrial metal. As ceasefire optimism briefly took hold mid-week, silver’s industrial demand angle kicked in alongside the safe-haven bid, amplifying the move.
The gold-silver ratio compressed further this week to approximately 59, down from 61 last week and 63 the week before. A tightening ratio historically signals either improving risk appetite or silver-specific demand — in this case, likely both. Silver remains deeply below its ATH of ₹4,20,048, sitting roughly 39% off that peak. That distance reflects just how severe the correction from January highs was. The 200 EMA at ₹2,00,468 provides a structural floor that is well below current prices, confirming the long-term uptrend is intact despite the correction.
Key Takeaway: Silver is the more active of the two triangles right now — it is leaning into resistance rather than drifting toward the apex. A confirmed breakout above the falling trendline would be a stronger signal for silver than for gold given the compressed ratio and industrial demand support. For trade participants with silver exposure, this week’s sharp move is a reminder that silver rewards patience but punishes size — the same structure that gave you 5.7% this week can reverse just as sharply on a hawkish FOMC or ceasefire breakthrough.
India Trade Pulse:
The World Gold Council’s March 2026 India update, released this week, provides important context for domestic price behaviour that is not visible in the MCX chart alone.
Supply tightness narrowed the domestic discount. Domestic gold had been trading at a sustained discount to international prices since mid-February, widening to around $46/oz in March. That discount has since narrowed sharply to around $8/oz in early April. The tightening reflects two factors: government restrictions on imports of platinum alloys containing gold, along with broader curbs on gold, silver, and platinum jewellery imports; and customs clearance delays on bullion consignments at nominated banks. For jewellers and importers, this means the landed cost of gold has crept closer to international benchmarks — the cushion that discounts provided has largely gone.
Imports hit a 9-month low. India’s gold imports fell to $3.1bn in March, estimated at 20-25 tonnes against a 12-month average of 62 tonnes. The primary cause was supply chain disruption — Middle East flight disruptions directly impacted bullion transit routes into India, given the region’s role as a key hub for physical gold flows. This is a structural supply constraint, not a demand story, and it reinforces the case for domestic prices holding firm even if international prices consolidate.
Akshaya Tritiya supported demand at the margin. The festival fell on April 19-20, coinciding with the final days of this week’s price action. Seasonal buying interest around this occasion is typically a reliable demand floor for physical gold and coins, and is likely a contributor to the steady price behaviour seen in the last few sessions of the week despite global volatility.
Listed jewellers delivered their best quarter of the year. Revenue growth across major listed retailers ranged from 32% to 124% year-on-year in Q1 2026 (January-March), driven by a robust wedding season, higher average ticket sizes, strong coin sales, and growing digital channels. This is not a price story — it is a demand confidence story. India’s jewellery trade is expanding into the elevated price environment rather than retreating from it.
Retail gold ownership is broadening. Indian gold ETF folios reached 12.39mn with Q1 2026 recording the strongest quarterly inflows on record. Gold now represents 2.3% of total mutual fund AUM, up from 0.9% a year ago. Meanwhile, digital gold purchases via UPI remain 53% above the preceding 13-month average. The physical jewellery trade and the financial gold ecosystem are growing in parallel — a structural demand backdrop that supports prices through cycles.
Source: World Gold Council, India Gold Market Update, March 2026. Used with permission in line with fair industry practice.
Watch Next Week:
- Ceasefire expiry and Hormuz: The two-week US-Iran ceasefire expires this coming week. Iran has already reinstated strait controls over the weekend. A formal breakdown with no extension is the sharpest upside catalyst for both metals; any credible deal framework would trigger a sharp correction.
- FOMC meeting — April 28-29: A hold is near-certain but the tone is everything. A hawkish hold that pushes US 10-year yields higher is the primary headwind for gold and silver right now. Watch Powell’s language on whether the energy-driven inflation is ‘transitory’ or ‘persistent’ — that single word choice will move markets.
- Triangle resolution: Both gold and silver are in compression patterns approaching their apex. The FOMC and Hormuz developments this week will almost certainly be the catalyst that determines direction. A breakout in gold above ₹1,60,000 and silver above ₹2,65,000-70,000 would signal continuation of the recovery. A breakdown below ₹1,50,000 and ₹2,40,000 would suggest the correction has further to run.
- Rupee and oil: Oil fell sharply this week on ceasefire optimism before recovering. If Hormuz tensions re-escalate, oil surges again, the rupee weakens further, and MCX prices will outperform COMEX on the upside. The INR/USD rate remains a critical amplifier for domestic precious metals pricing.
- Disclaimer: This article is for informational purposes only and does not constitute investment or trading advice. MCX prices are futures closing prices. COMEX prices are spot reference prices. Past performance is not indicative of future results. India Trade Pulse section draws on data from the World Gold Council India Gold Market Update, March 2026, used in line with fair industry practice with citation to the World Gold Council as source.
Authored by Dhawal Chotai
