


Macro Snapshot: The week ending 30 October brought the kind of news that once sent buyers into gold. Reuters reported the first known successful limpet-mine strike on a tanker in the Strait of Hormuz since the war began in February, and Houthi forces claimed strikes on Saudi refineries. Washington ordered non-emergency government staff out of Saudi Arabia amid reports that US strikes on Iran could resume after the 3 November midterm elections. Brent rose 13.6% over October, with the expiring December contract settling at $117.64 a barrel on 30 October and January at $113.43, while WTI settled at $104.12 against $103.27 a week earlier. Gold fell 2.7% on COMEX and silver 8.7%, leaving gold about 28% below its 28 January record close of $5,419.83.
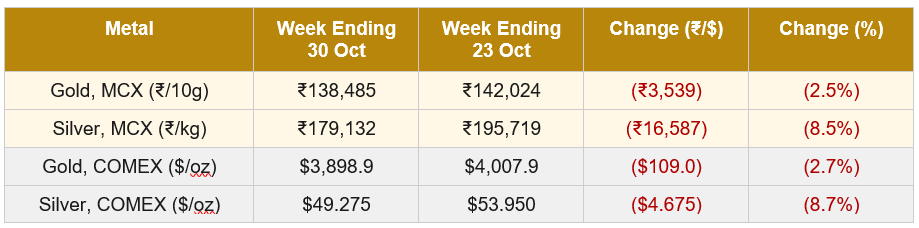
The war is reaching gold through oil, and oil is reaching it through the Fed. Higher energy costs keep inflation risk alive, and the FOMC that held its target range at 3.75% to 4% on 28 October did so with Lisa Cook and Beth Hammack dissenting in favour of an immediate hike. Futures priced roughly a 76% to 83% chance of a December hike throughout the week, and the 10-year Treasury yield ended at 4.94% and the 30-year at 5.31%, against 5.00% and 5.33% a week earlier. “The indication was that the higher-for-longer theme prevails,” Zaner Metals’ Peter Grant told Reuters, as quoted by Mining.com. With a riskless dollar asset paying close to 5% and further hikes priced, the cost of holding a metal that pays nothing outweighs the insurance it offers against the war.
Where investors did seek safety, they bought Treasuries rather than bullion. TD Securities’ Bart Melek told Bloomberg, as reported by Mining.com, that higher oil was driving a risk-off move into Treasuries that drained liquidity from equities and bullion alike. Friday showed it: Intel fell about 29% after weak guidance, the Nasdaq lost 2.9%, and December gold futures settled at $3,898.90, down 3.3%, as the 10-year yield slipped four basis points. BMO Capital Markets counted $1.7 billion of outflows from North American gold ETFs in the week ended 23 October, a sign that Western investors are selling the metal rather than hiding in it.
Indian buyers took the full global fall. The FBIL reference rate weakened from 94.9432 per dollar on 23 October to 95.2492 on 30 October, touching 95.3688 on 29 October, the day foreign institutional investors sold a net ₹943.60 crore of equities. A late 33-paise rally on Friday, which traders attributed to RBI intervention, left spot at a provisional 94.93, unchanged on the week, so MCX moved almost in step with COMEX. IMF spokesperson Julie Kozack said on 29 October that “the rupee should be the first line of defence” against energy shocks; if the RBI steps back, a weaker rupee would lift MCX relative to COMEX, supporting holders while raising jewellers’ restocking costs.
Gold-specific drivers: Physical demand has not yet stepped in. Mining.com reported on 30 October that buying in India and China remained subdued as customers waited for lower prices, while BMO said the decline was beginning to draw physical buyers back. Dhanteras on 6 November and Diwali on 8 November are the first real test of whether Indian buyers treat a 28% fall from the record as an opportunity, with the rupee flat and lower prices the only incentive.
Silver-specific drivers: Silver gets the worst of both channels, earning no haven bid in a war that keeps yields near 5% while suffering, as an industrial metal, when higher energy costs and tighter policy threaten growth. MCX silver was down 3.2% by Thursday’s close while gold edged higher, then lost another 5.4% on Friday. COMEX silver fell below $50 on 30 October for the first time since November 2025, ending October down about 18%. Indian demand offers little offset, with Metals Focus’ Harshal Barot telling Bloomberg on 22 October that he saw no meaningful dip-buying and fresh import permits leaving supply ample. The gold-silver ratio on the closing figures above widened to about 79.1 from 74.3, its highest since December.
Gold | MCX GOLD1!
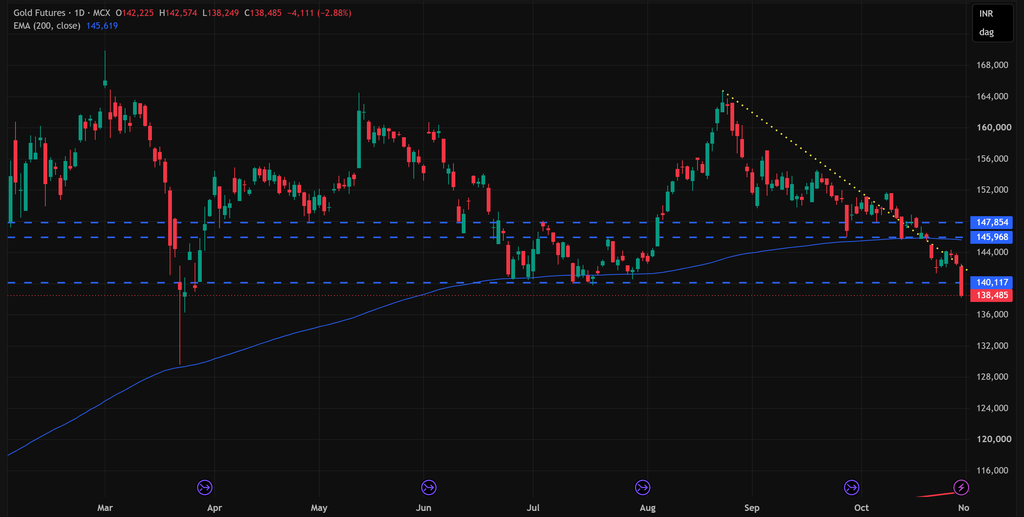
MCX gold confirmed its breakdown through a failed retest. After breaking the ₹145,968 to ₹147,854 band on 22 October, the December contract bounced from Monday to Wednesday to around ₹144,300, stalling beneath both the band and the 200-day EMA at ₹145,619 and close to the descending trendline from the August peak. Thursday turned lower, and Friday’s session ran from an open of ₹142,225 to a close of ₹138,485, just ₹236 above the low, a 2.9% expansion that showed no buying into the weekend.
Friday’s close fell below the ₹140,117 line, which marks the late-March closes and the July lows on the chart. Both were printed on cheaper, expired contracts: the July lows on the August contract, two rollovers back, and the March closes on the April contract, four rollovers back. The 1.75% to 2% gap between the December and February contracts over the past week implies those levels sit near ₹145,000 to ₹146,000 and ₹150,000 to ₹152,000 in December-contract terms. The February contract trades thinly, but even a lower roll cost of 1.25% per rollover would place them at about ₹143,500 and ₹147,000, still above Friday’s close. Friday therefore confirmed a breakdown that began on 22 October rather than starting a new one.
The nearest print below price is the intraday spike low of late March, which adjusts to somewhere between roughly ₹136,000 and ₹140,000 depending on the roll cost assumed, too wide a band read off a single wick to treat as support. Overhead, the ₹142,600 to ₹144,300 zone where the midweek bounce failed is the first resistance, and only a daily close back above ₹145,968 would turn this into a failed breakdown.
| Key Takeaway: As long as the war works on gold through oil, inflation and rates, escalation is a headwind rather than a support, and the headlines that once drew buyers now add pressure. Jewellers stocking for Dhanteras on 6 November are buying beneath every adjusted floor on this chart, with no reliable reference below price and resistance at ₹142,600 to ₹144,300. |
Silver | MCX SILVER1!
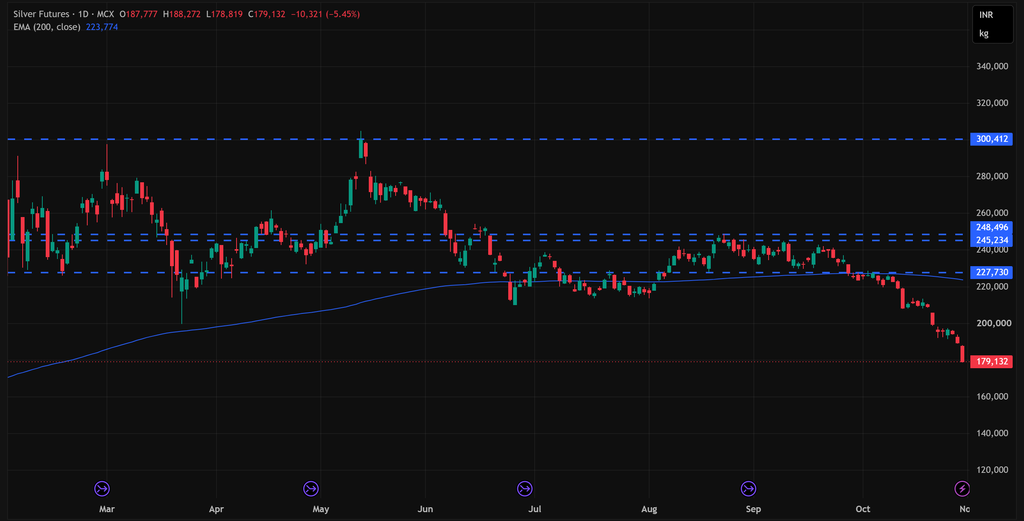
Silver’s low of ₹192,149 from 23 October held for three sessions, with price compressing between roughly ₹192,000 and ₹198,000, before Thursday closed beneath it at ₹189,453. Friday then opened lower at ₹187,777 and closed at ₹179,132, just above the ₹178,819 low, a 5.4% expansion with barely any lower wick, unlike the reaction candle a week earlier.
Price now sits about 20% beneath the falling 200-day EMA at ₹223,774, against 4.9% for gold, and more than 40% below the May spike high at ₹300,412. The lowest earlier prints on this chart, the late-March wick near ₹200,000 and the June lows near ₹210,000, came on the May and July contracts and sit higher still once adjusted to December terms. Silver is trading below every level this chart has recorded, with no defined support beneath it.
The read is a confirmed breakdown that is still accelerating. Any bounce would meet its first ceiling between ₹189,000 and ₹192,000, where Thursday’s close and the broken low now sit, and the stretch from the EMA raises the odds of a sharp relief rally without supplying any evidence that one has begun.
| Key Takeaway: Silver slid while gold edged higher from Monday to Thursday, then fell almost twice as far as gold on Friday, so its decline cannot be read as collateral damage from gold alone. With no support on the chart and supply in India no longer scarce, stockists should treat a bounce toward ₹189,000 to ₹192,000 as a test of resistance, not a turn. |
Watch in the Days Ahead:
- Iran after the midterms, 3 November: Escalation would push oil and hike pricing higher, tightening the squeeze on both metals; progress in the Qatari-mediated talks would ease it.
- October payrolls, 6 November: Strong hiring would harden the case for a hike at the 8 to 9 December FOMC; a miss would loosen it.
- Dhanteras and Diwali, 6 and 8 November: Firm Indian buying at these levels would be the first sign of physical demand absorbing Western selling.
- Rupee policy: A step back by the RBI, as the IMF urged, would likely weaken the rupee, lifting MCX relative to COMEX and raising jewellers’ import costs.
- Levels: Gold resistance at ₹142,600 to ₹144,300, then ₹145,968. Silver resistance at ₹189,000 to ₹192,000, with no defined support.
Disclaimer: The views expressed are for informational purposes only and do not constitute investment advice or a recommendation to buy or sell any commodity or derivative. Readers should consult a qualified adviser before making investment decisions.
Authored by Dhawal Chotai