


Macro Snapshot: The FOMC held rates at 3.50 to 3.75% on July 29 by a 9 to 3 vote, with three members dissenting in favour of a quarter-point hike. Chair Kevin Warsh described inflation as a ‘choice’ and made clear the Committee would move quickly if incoming inflation data ran hot. Going into the week ending August 7, CME FedWatch put September hike odds near 58%. That framing collapsed on Friday. The Bureau of Labor Statistics reported that US employers shed 23,000 jobs in July against a consensus of an 80,000 gain, with May and June revised down by a combined 103,000. The headline unemployment rate fell to 4.1% from 4.2%, but the decline reflected a shrinking labour force rather than hiring. September hike odds fell to roughly 42% by Friday close. The dollar dropped to a two-week low.
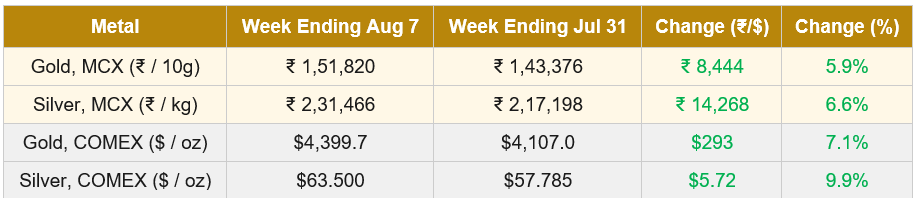
Rupee movement: The rupee traded a wider daily range across the reporting week than in the July sessions preceding it. It opened near 95.40 on August 3 after ending July at 95.40, firmed to a weekly low of 94.89 on August 5 as oil sold off on Iran-Oman de-escalation hopes, backed up mid-week on renewed Strait of Hormuz tensions, and closed near 95.13 on August 7. That is a modest firming of roughly 0.3% for the week. The rupee cushion therefore worked in reverse across the reporting week: MCX gold gained 5.9% versus a 7.1% rise in COMEX gold, and MCX silver gained 6.6% versus a 9.9% rise in COMEX silver. Dollar-side strength did the work; the currency took a small edge off the domestic move.
Oil and yields: WTI settled at roughly $78.20 per barrel on August 7, up about 1% on the session but down more than 7% for the week. Brent traded above $83 with a similar weekly decline. The dominant driver was the Iran-Oman negotiation over Strait of Hormuz shipping, which pulled geopolitical risk premium out of crude early in the week, before late-week reports of attacks near Qeshm Island reinjected some of it. The US 10-year Treasury yield closed at roughly 4.65% on August 7, down 7 basis points on the payroll print. The 30-year settled at 5.19%, off the multi-decade highs of 5.24% posted after the July 29 FOMC. Falling long yields, a weaker dollar, and softer crude combined into a textbook backdrop for precious metals; the payroll print supplied the trigger.
Gold-specific drivers: The macro pivot was reinforced by fresh WGC data. Central banks bought a net 289 tonnes in Q2 2026, a 62% jump year over year and the strongest Q2 in the series, per the Gold Demand Trends report published July 30. Global gold-backed ETF flows for July, released August 6, showed the first meaningful inflow since spring: $3 billion in net inflows, holdings up 23 tonnes to 4,068 tonnes, with European-listed funds leading and Asian funds following. North America stayed in net outflow territory. The domestic picture in India is defined by the 15% import duty in place since May 13 and the roughly 18.45% total levy after IGST. WGC’s mid-July India update showed the domestic discount to landed price, which peaked near $150 per ounce in mid-May, has held closer to $20 to $40 per ounce, with rising old-gold exchange volumes cited as the swing factor in domestic supply.
Silver-specific drivers: Chinese customs data showed imports of silver-bearing ores surging 62.5% year over year in June, keeping the industrial demand engine visible even before the Fed repricing arrived. The Silver Institute’s projected 46.3 million ounce global supply deficit for 2026, the sixth consecutive year of shortfall, remains the structural anchor. The gold-silver ratio compressed to roughly 67 from 69 a week earlier as silver outperformed on the payroll release, up 4% on August 7 alone and up close to 11% over the seven-session span. That is the classic signature of silver in a bullish rotation: the industrial-monetary dual mandate amplifies the rate-repricing signal that gold responds to more sedately.
Gold | MCX GOLD1!
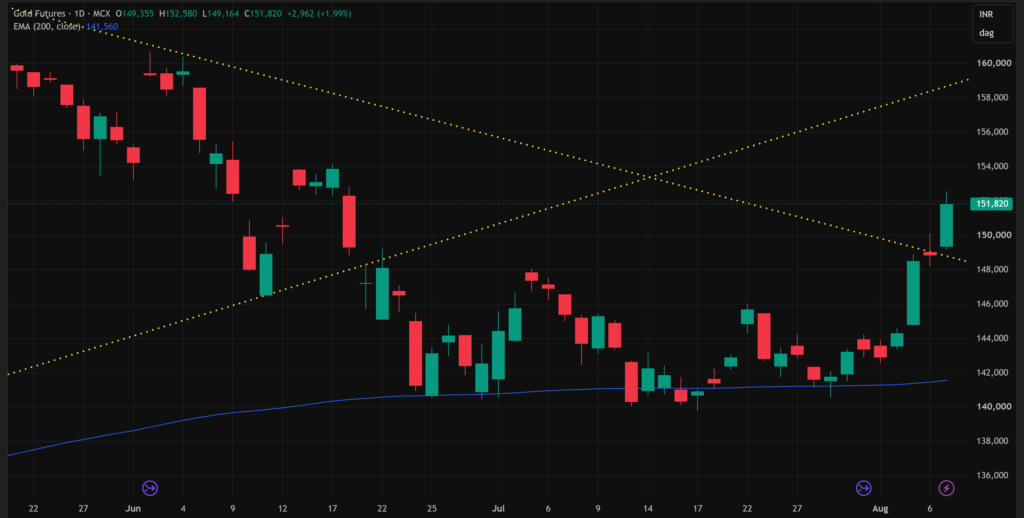
Gold on MCX transitioned decisively out of the June to July decline in the week ending August 7. After repeatedly finding support around ₹1,40,000 to ₹1,42,000 through July, the sequence of progressively stronger daily candles culminated in Friday’s ₹1,51,820 close, well clear of the 200-day EMA at ₹1,41,560. The descending yellow trendline that had capped every recovery attempt since the May peak has now been broken with acceptance, not merely wicked through: Friday’s candle closed above the line and near the upper end of its range, providing initial follow-through.
The rising yellow trendline visible on the chart should not be interpreted as the lower boundary of an intact triangle. Price broke beneath it much earlier and spent an extended period underneath, which invalidates the symmetrical consolidation reading. The two yellow lines therefore no longer describe a valid pattern; the current setup is a fresh breakout from a descending resistance rather than a triangle resolution.
Momentum in this leg is expanding rather than drifting higher. The move from ₹1,43,000 through ₹1,48,000 and into the ₹1,51,000 area has produced relatively large directional candles with limited pullback, which is more consistent with an impulse than a corrective bounce. What matters next is overhead evidence around ₹1,52,500 to ₹1,54,000. Friday’s high touched ₹1,52,580 but did not yet demonstrate sustained acceptance through the prior June reaction area. A pullback that holds ₹1,48,000 to ₹1,50,000 would strengthen the case that the former descending trendline has genuinely flipped from resistance into support. A rapid close back beneath ₹1,48,000 would weaken the breakout interpretation substantially.
| Key Takeaway: Attempted breakout with early acceptance. The short-term structure is materially more constructive, but the stronger reversal case still needs either continued closes through ₹1,52,500 to ₹1,54,000 or a successful retest of the breakout area. For Indian dealers, MCX gold is now at a level where the price-sensitive slice of jewellery demand typically pauses and old-gold exchange volumes tend to build, which has been the swing factor in the domestic discount picture through the summer. If Friday’s break holds, the rupee will need to weaken to keep MCX moving with COMEX; if the rupee firms further, the domestic move will trail. |
Silver | MCX SILVER1!
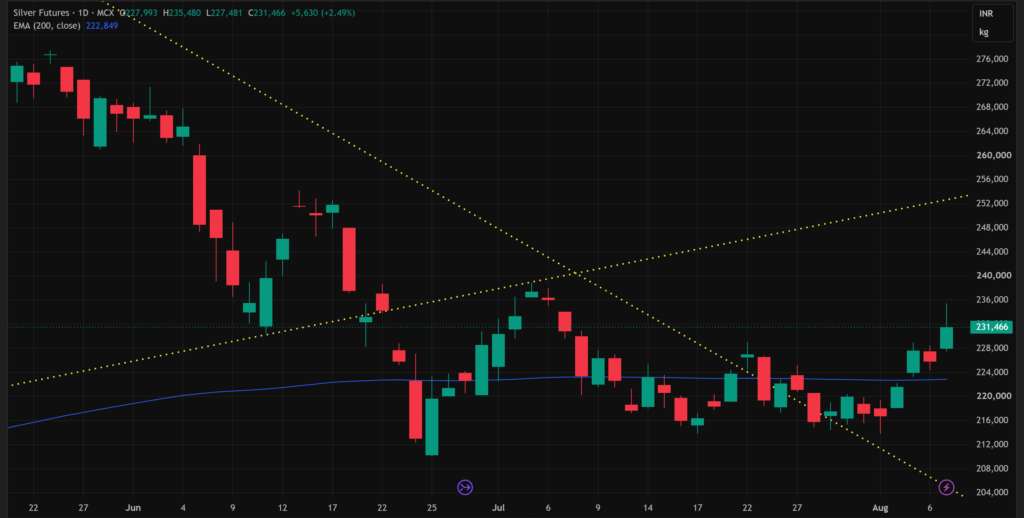
Silver moved further out of the June to July decline than gold did. Price recovered above the 200-day EMA at ₹2,22,849 during the week, and rather than failing immediately back underneath, continued higher to a ₹2,31,466 close on August 7. The descending yellow trendline was broken earlier in the sequence and price has continued away from it over several sessions. That is a stronger form of acceptance than a single-day trendline penetration and argues the old descending resistance structure is broken rather than merely tested.
As with gold, the rising yellow line does not describe an intact lower boundary. Silver broke beneath it well before the current move and remained below for a prolonged period. The apparent large “X” on the chart should not be read as a valid triangle. The structural read is a fresh trendline breakout from below, not a triangle resolution.
Friday’s candle was bullish but less clean than gold’s. Silver traded as high as ₹2,35,480 before closing at ₹2,31,466. That upper wick indicates meaningful supply in the ₹2,34,000 to ₹2,36,000 area, which also corresponds with the early-July swing region. One wick is not sufficient to call the rally rejected, but it is evidence that supply exists there and will need to be absorbed for the next leg. Structural improvement is nevertheless clear: the late-July base around ₹2,15,000 to ₹2,20,000 has been followed by a break above the EMA and expanding upside candles. Holding above roughly ₹2,23,000 to ₹2,25,000 would preserve that improvement; acceptance through ₹2,34,000 to ₹2,36,000 would be the next important structural confirmation.
| Key Takeaway: The trendline break is already showing follow-through, and silver is transitioning toward a bullish structure rather than merely bouncing. The unresolved issue is the reaction at ₹2,34,000 to ₹2,36,000. Failure there followed by loss of the 200-day EMA would argue that the rally of August 3 to 7 remains a recovery leg rather than a broader reversal. Silver is a little further along in its trendline breakout than gold and it has outrun gold on a percentage basis for the week, but gold has the cleaner August 7 candle and greater distance above its 200-day EMA. For Indian silver traders, the gold-silver ratio compression to 67 has rewarded stackers who added on the July weakness, and the industrial-demand tailwind from Chinese ore imports provides a floor under any pullback that a pure monetary rally would not offer. |
Watch in the Days Ahead:
- US July CPI on August 12: The single most important print in the days ahead. Chair Warsh has told the market he will hike in September if CPI runs hot, and Friday’s payroll-driven repricing is entirely contingent on inflation not confirming his stated trigger. A print above roughly 2.9% year over year on headline or above 3.1% core would revive September hike bets and pressure both metals. An in-line or softer print would reinforce the payroll-driven pivot and open the path for gold to test ₹1,54,000 and silver to attack ₹2,36,000 on MCX.
- US July PPI on August 13: The upstream inflation read. PPI producer pressure often feeds into CPI expectations for subsequent months, and any surprise in either direction after Wednesday’s CPI will compound or reverse the initial reaction.
- University of Michigan inflation expectations on August 14: The survey-based read on inflation psychology. Matters most when hard data has been mixed, which it now is.
- Fed speakers through the balance of August: Any explicit walk-back from Warsh or the July 29 dissenters will move September odds again ahead of the September 16 meeting. A single hawkish reaffirmation from a voting FOMC member could compress the Friday payroll gains quickly.
- Strait of Hormuz shipping developments: Iran’s parliament vote on the shipping arrangement, and any attacks or attempted transits through the strait, will move oil and the safe-haven premium. A definitive Hormuz resolution would remove a source of premium from both crude and precious metals; further deterioration would restore it.
- Technical levels to watch: Gold: sustained closes above ₹1,52,500 to ₹1,54,000 (MCX) would confirm the breakout; a pullback holding ₹1,48,000 to ₹1,50,000 would provide the cleanest retest. A close back beneath ₹1,48,000 weakens the breakout. Silver: acceptance through ₹2,34,000 to ₹2,36,000 (MCX) would be the next structural confirmation; loss of ₹2,23,000 to ₹2,25,000 back below the 200-day EMA would reduce the move to a recovery bounce.
Disclaimer: This article is provided for informational purposes only. It is not investment advice, a recommendation to buy or sell any security, or a solicitation of any offer to transact. Readers should consult their own advisors before acting on any information contained herein. Prices are as of the close of business on the dates indicated.
Authored by Dhawal Chotai