


Macro Snapshot: The week ending July 31 delivered two of the most consequential macro events of 2026, and neither resolved the stalemate that has defined gold and silver for five weeks. On Wednesday July 29, the Federal Reserve held rates at 3.50-3.75% in a divided 9-3 vote. Three regional Fed presidents (Cleveland’s Beth Hammack, Minneapolis’ Neel Kashkari, and Dallas’ Lorie Logan) dissented in favour of an immediate 25 basis point hike, the largest number of dissents for rates to move in one direction since September 2016. Chair Warsh called the split “a good family fight,” reiterated that there is “no soft inflation target,” and continued his practice of providing no forward guidance. The statement was nearly unchanged from June.
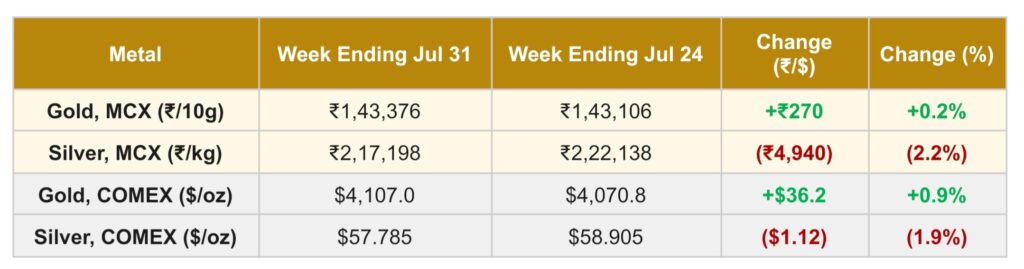
On Thursday July 30, the Bureau of Economic Analysis released the Q2 GDP advance estimate at 1.5% annualized, well below the 2.1% consensus and down from Q1’s 2.1% pace. But the internal composition told a more nuanced story. The GDP price index (a broad measure of inflation within the output data) surged to 5.7% annualized, up from 3.6% in Q1, driven almost entirely by energy costs. Core PCE within the GDP report, by contrast, fell to 3.4% from Q1’s 4.4%, suggesting the non-energy inflation picture is actually improving. Final sales to private domestic purchasers (which strips out volatile trade and inventory effects) rose 3.9%, sharply higher than Q1’s 1.7%, indicating that underlying private-sector demand is stronger than the headline implies. The June PCE, released the same day, came in at 3.7% headline and 3.3% core, both in line with consensus.
The data painted a picture that was simultaneously stagflationary on the surface (slower growth, higher headline inflation) and constructive underneath (core inflation easing, private demand accelerating). For the metals, the ambiguity was the point. Gold gained 0.9% on COMEX. Silver fell 1.9%. Neither moved decisively. The macro events that should have produced a clear directional signal (a divided Fed, a GDP miss, yields at multi-year highs) were absorbed without a resolution, extending the consolidation for another week.
The rates-and-dollar complex was the most aggressive it has been since the correction began. The 10-year Treasury yield rose 5 basis points on FOMC day to close at 4.657%. The 30-year Treasury yield rose 9 basis points to 5.193%, its highest level since 2007. September rate-hike odds on CME FedWatch adjusted from approximately 76% pre-meeting to approximately 58% post-meeting, a modest dovish shift relative to expectations. The dollar eased on the softer GDP reading, which allowed COMEX gold to hold its gains despite the yield pressure.
The rupee strengthened approximately 1% over the week, moving from the 96.40-96.57 range at the prior Friday (July 24-25) to approximately 95.60-95.73 by Wednesday July 29 (MTFX data). The appreciation reflected two forces: the broader dollar pullback after the GDP miss, and continued improvement in India’s external account as oil prices declined. WTI crude fell roughly 6% on the week, from $90.47 on July 24 to approximately $84.67 on July 31 (Trading Economics), despite Iran attacking two more tankers transiting the Strait of Hormuz on Friday. Oil eased mid-week after Saudi Arabia proposed a naval coalition of 43 countries to protect Red Sea shipping routes, a stabilising development. The rupee’s 1% appreciation explains the MCX-COMEX divergence: MCX gold gained only 0.2% (versus COMEX’s 0.9%) because the stronger rupee absorbed part of the dollar-denominated recovery. MCX silver fell 2.2% (versus COMEX’s 1.9%) because the same rupee appreciation added to the domestic decline.
Gold-specific drivers. Gold on COMEX gained 0.9%, effectively flat given the scale of the macro events. The metal is now trading squarely within the WGC Mid-Year Outlook’s base case of $4,100 ± 5% for H2 2026. The structural bid continues: China’s 20-month consecutive buying streak remains intact, and the WGC Central Bank Survey’s record 45% of central banks planning to add gold provides an institutional floor. The stagflationary GDP data (weak growth, high headline inflation) is a historically ambiguous signal for gold: it supports gold’s role as an inflation and uncertainty hedge but also raises the prospect of tighter policy that would lift real yields. The fact that gold absorbed a divided Fed with three hawkish dissents, a 30-year yield at its highest since 2007, and a GDP miss without breaking lower is consistent with the resilience pattern that has held since the 200-day EMA was first tested in late June.
Silver-specific drivers. Silver fell 1.9% on COMEX and 2.2% on MCX, diverging from gold’s modest gain and widening the gold-silver ratio further. A weaker GDP headline is bearish for silver’s industrial demand engine, even though the underlying private-sector demand data was strong. The hawkish Fed dissents and 30-year yields at multi-year highs cap silver’s monetary premium. Silver’s failed breakout above the 200-day EMA at approximately ₹2,23,000-₹2,25,000, followed by a return to the lower end of the range near ₹2,15,000-₹2,18,000, keeps the near-term structure weaker than gold’s. The silver chart is now showing a clear pattern: demand near ₹2,15,000 holds, rallies fail at the 200-day EMA, and price drifts back. That is a range, not a trend, and it will resolve when the macro setup changes.
Gold | MCX GOLD1!
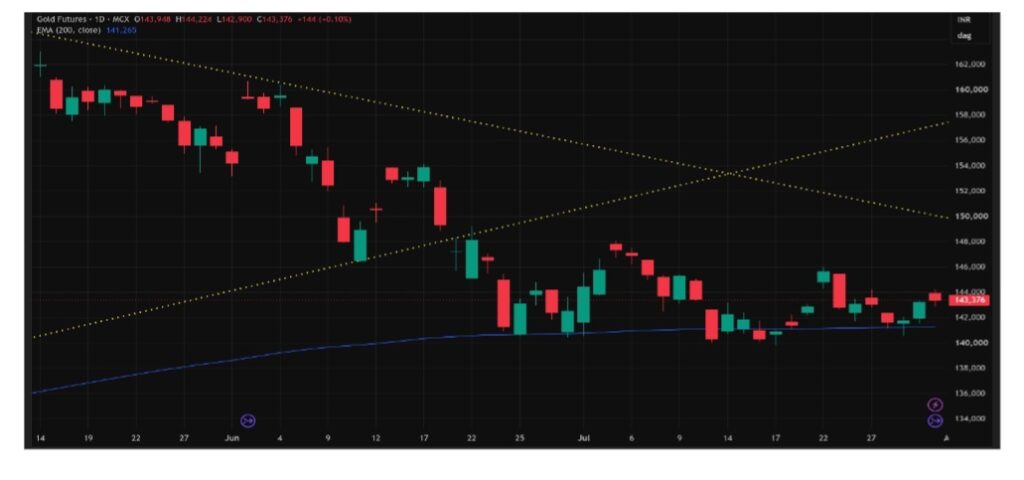
Gold remains in a tight consolidation above the 200-day EMA, with repeated demand emerging around ₹1,40,000-₹1,41,500. Recent probes into this area have not produced sustained closes below the moving average. The rebound toward ₹1,45,500-₹1,46,000 failed, and subsequent recovery highs have been lower. The latest candle rejected from approximately ₹1,44,200 and closed near ₹1,43,400, confirming that ₹1,44,000-₹1,46,000 remains active supply.
The recent decline back toward the EMA did not develop into downside expansion. Buyers again reacted near ₹1,41,000-₹1,42,000, making this another failed breakdown attempt rather than confirmed acceptance below support. The former yellow trendline structure remains broken and invalidated; both old boundaries are now above price. The active structure is a post-breakdown base, with flat demand around the 200-day EMA but progressively lower recovery highs.
Pattern status: still consolidating, with a mild bearish tilt because sellers are appearing at lower levels with each attempt. Five weeks of consolidation around a major moving average typically precedes a directional move. The tightening range is building energy for a resolution. Acceptance above ₹1,44,500-₹1,46,000 would improve the structure; a decisive close below ₹1,40,000-₹1,41,000 would confirm a fresh breakdown.
Key Takeaway: Gold is still consolidating above the 200-day EMA after repeated failed breakdown attempts around ₹1,40,000-₹1,41,500. The defining observation: neither a divided Fed (three hawkish dissents, the most since 2016), nor a GDP miss (1.5% versus 2.1% consensus), nor 30-year yields at their highest since 2007 broke the consolidation. The correction is ten weeks old. The floor has not broken. That persistence is either a market waiting for a bigger catalyst, or a market that has already found its structural floor. The resolution will come from the macro setup (Jackson Hole, September FOMC, oil trajectory) rather than from the current range itself.
Silver | MCX SILVER1!
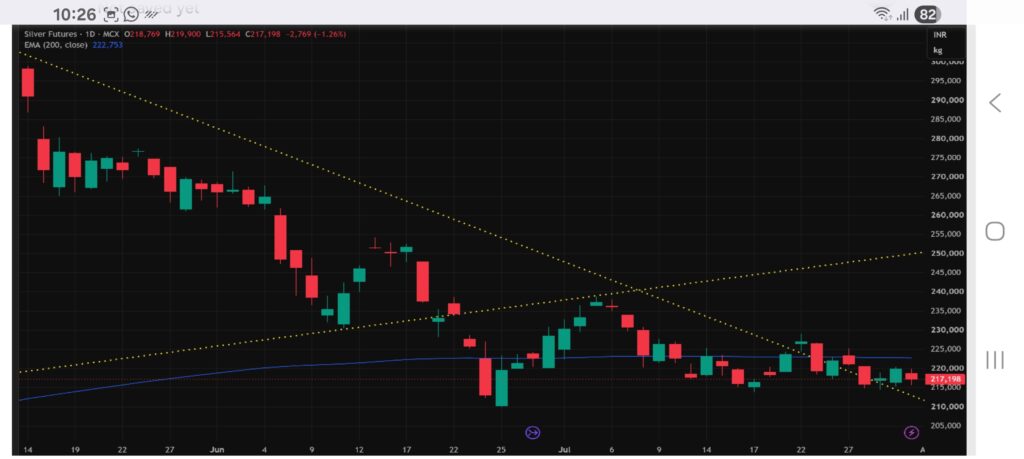
Silver remains trapped in a lower range between approximately ₹2,15,000 and ₹2,26,000, but the structure is weaker because price continues to trade below the 200-day EMA near ₹2,22,750. The late-July rally briefly pushed above the descending yellow trendline and the 200-day EMA area, but it was rejected around ₹2,25,000-₹2,27,000 and immediately fell back below both. That was a clear failed breakout with no bullish follow-through.
Recent candles have returned to the ₹2,15,000-₹2,18,000 demand zone. The latest candle tested approximately ₹2,15,500 and closed near ₹2,17,200, showing a reaction from demand but not a strong reversal. Bearish momentum is compressed rather than expanding. Price is drifting along the lower portion of the range, while repeated failures below ₹2,23,000-₹2,25,000 show that the 200-day EMA has become persistent overhead supply.
Pattern status: still consolidating, but with a clearer bearish bias than gold. A close below ₹2,14,000-₹2,15,000 would confirm the next breakdown leg. Acceptance above ₹2,23,000-₹2,25,000 is required to invalidate the failed-breakout structure. The divergence between gold (above the EMA) and silver (below it) has now persisted for five weeks. In prior cycles, sustained divergence at the 200-day line has typically resolved in one of two ways: either silver catches up by reclaiming the EMA, or gold eventually follows silver below it. The resolution of this divergence is among the most important technical signals to watch.
Silver remains trapped in a lower range between approximately ₹2,15,000 and ₹2,26,000, but the structure is weaker because price continues to trade below the 200-day EMA near ₹2,22,750. The late-July rally briefly pushed above the descending yellow trendline and the 200-day EMA area, but it was rejected around ₹2,25,000-₹2,27,000 and immediately fell back below both. That was a clear failed breakout with no bullish follow-through.
Recent candles have returned to the ₹2,15,000-₹2,18,000 demand zone. The latest candle tested approximately ₹2,15,500 and closed near ₹2,17,200, showing a reaction from demand but not a strong reversal. Bearish momentum is compressed rather than expanding. Price is drifting along the lower portion of the range, while repeated failures below ₹2,23,000-₹2,25,000 show that the 200-day EMA has become persistent overhead supply.
Key Takeaway: Silver is still consolidating below the 200-day EMA after a failed breakout above ₹2,23,000-₹2,25,000. Demand near ₹2,15,000 is slowing the decline, but the structure stays bearish until the EMA is reclaimed. The GDP miss (1.5% versus 2.1% consensus) is a mixed signal: weaker growth is negative for the industrial demand engine, but it also reduces the case for aggressive rate hikes, which supports the monetary premium. Silver’s inability to resolve this tension is visible in the chart: demand holds, supply holds, and the range tightens without producing direction.
Watch in the Days Ahead:
- Jackson Hole (August 27-29): Fed Chair Warsh is expected to speak at the Jackson Hole Economic Policy Symposium. His address will be the most important public commentary between the July and September FOMC meetings. Markets will parse the speech for any shift in emphasis between inflation urgency and growth concerns. Given the GDP data and the three dissents, Warsh’s framing will meaningfully reprice September expectations.
- September FOMC (September 15-16): With three July dissenters wanting to hike and September odds at approximately 58%, the meeting is live for the first rate hike of the cycle. A new Summary of Economic Projections and dot plot will be released. The consolidation in both metals is likely to persist until the September meeting or Jackson Hole provides resolution.
- July jobs data (August 7): After the weak June NFP (57,000 versus 110,000 consensus), the July report will indicate whether the labour market is genuinely softening or whether the June number was an outlier. A strong print would reinforce September hike pricing. A weak print would ease it and support the metals.
- Oil and Iran: WTI fell roughly 6% on the week to approximately $84.67, despite Iran attacking two more tankers on Friday July 31. Saudi Arabia’s proposed 43-country naval coalition to protect Red Sea shipping is a stabilising force. If oil continues to ease despite the conflict, the inflation-expectations headwind for gold and silver would weaken. If the conflict intensifies further, oil resumes its upward path and the rates-and-dollar mechanism retightens.
- Gold at ₹1,40,000-₹1,46,000: Five weeks of consolidation is tightening the range. A close above ₹1,44,500-₹1,46,000 would signal a base. A close below ₹1,40,000 would confirm the EMA breakdown. The longer the range holds without breaking, the larger the eventual directional move is likely to be.
- Silver at ₹2,14,000-₹2,25,000: Silver’s range is wider but the bias is clearer. A break below ₹2,14,000 would start the next downside leg. A reclaim of ₹2,23,000-₹2,25,000 would challenge the failed-breakout read and close the divergence with gold.
Disclaimer: This article is for informational purposes only and does not constitute investment or trading advice. All prices are futures closing prices, MCX in INR, COMEX in USD. FOMC data sourced from the Federal Reserve official statement (July 29, 2026). GDP data sourced from the US Bureau of Economic Analysis advance estimate (July 30, 2026). Oil prices sourced from Trading Economics (July 31, 2026). Rupee data sourced from MTFX historical rates. Past performance is not indicative of future results.
Authored by Dhawal Chotai