


Macro Snapshot: The week ending July 24 was one of the most volatile macro weeks of 2026, and the most significant feature was not what moved, but what did not. Oil spiked, yields surged to their highest since January 2025, and the conflict between the US and Iran escalated to its most intense phase since the February strikes. Gold and silver gained on the week. That resilience at the bottom of a multi-week correction, against headwinds that should have pushed both metals lower, is the defining price behaviour of the period.
The escalation was the dominant force through the week. The US carried out its 13th consecutive day of strikes on Iran by Friday, targeting military infrastructure and maritime capabilities. Iran responded with attacks on US bases in Kuwait, Jordan, and Bahrain. Iran-backed Houthi militants attacked two Saudi oil tankers in the Red Sea, opening a second front in the energy supply disruption. The Caspian Pipeline Consortium suspended crude loadings at its Black Sea terminal after tanker attacks, disrupting approximately 80% of Kazakhstan’s oil exports. President Trump stated he was considering a “massive attack” on Iran and vowed “severe retaliation” against any further Houthi attacks on Red Sea shipping. On Friday, oil eased after reports that Pakistan was mediating US-Iran talks with China’s backing.
Oil prices reflected the compound supply disruption: Brent crude briefly surged above $100 per barrel on Tuesday July 22 (the highest since the April conflict peak), before settling near $90 by Friday on the Pakistan mediation report. WTI crude closed at $90.47 on Friday, up more than 10% on the week. The oil spike fed directly into the rates-and-dollar mechanism: the US 10-year Treasury yield rose to 4.69% on July 24, its highest level since January 2025. The September rate-hike probability on CME FedWatch rose to nearly 80%. CNBC reported that the 10-year yield “could test 5%” if the oil-driven inflation impulse persists.
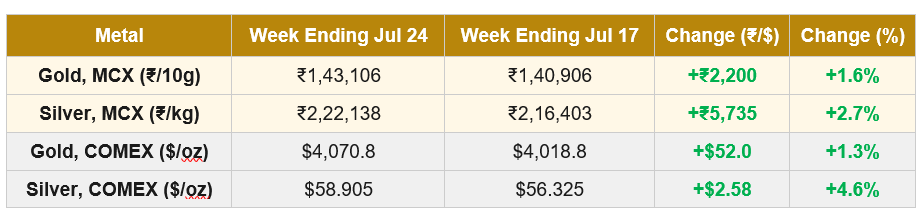
The rupee traded in a narrow band between approximately 96.2 and 96.9 (USD/INR) through the week, roughly flat in net terms. With no meaningful currency effect, MCX gold’s 1.6% gain closely tracked COMEX’s 1.3%. MCX silver gained 2.7% against COMEX silver’s 4.6%, with the shortfall reflecting muted domestic silver demand at elevated rupee-adjusted levels.
Gold-specific drivers. Gold gained 1.3% on COMEX despite the 10-year yield reaching 4.69% and the dollar remaining firm. The resilience likely reflects two forces. First, the safe-haven bid from the intensifying conflict (Houthi Red Sea attacks, CPC pipeline suspension, Trump’s “massive attack” rhetoric) partially offset the rates headwind. Second, the structural demand story (China’s 20-month consecutive buying streak, the WGC’s $4,100 ± 5% H2 base case, and the WGC Central Bank Survey showing a record 45% of central banks planning to add gold) continues to provide a floor under the market even as cyclical forces push from above. Gold spot traded between approximately $4,040 and $4,130 through the week, with rallies being faded but selloffs being absorbed.
Silver-specific drivers. Silver’s 4.6% COMEX gain outpaced gold’s 1.3%, and the gold-silver ratio compressed from approximately 71 to around 69. Silver’s higher beta is once again visible on the upside, the same characteristic that made it fall harder through the June-July correction. The Silver Institute’s 46.3 Moz projected 2026 deficit remains the structural anchor. The 200-day EMA at approximately ₹2,23,000 is now the immediate resistance level. MCX silver’s 2.7% gain underperformed COMEX silver’s 4.6%, suggesting that domestic buyers are not yet absorbing the recovery at the same pace they absorbed the selloff in prior weeks.
Gold | MCX GOLD1!
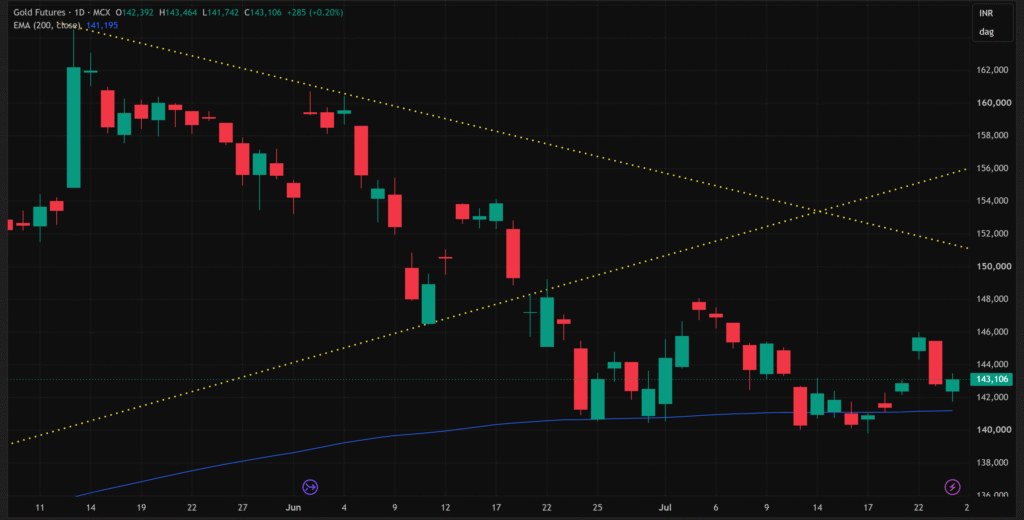
The recent sequence is a range around the 200-day EMA, not a clean directional move. Price has repeatedly found demand around ₹1,40,000-₹1,41,500, but each rebound has struggled to sustain above ₹1,44,000. The latest recovery reached approximately ₹1,45,500-₹1,46,000 before being sharply rejected. That reversal erased most of the advance and confirms this area as immediate supply rather than a completed breakout.
The most recent candle reacted from ₹1,41,700 and closed near ₹1,43,100, showing that buyers are still defending the EMA region. However, the modest body and lack of follow-through indicate stabilisation, not renewed upside momentum. The lower trendline was broken earlier and is now well above price, so the former compression pattern is invalidated. The active structure is a post-breakdown base with lower recovery highs.
Pattern status: still consolidating, with a bearish tilt. Acceptance above ₹1,45,500-₹1,46,000 would improve the structure and signal that the EMA defence is producing a genuine base. A decisive close below ₹1,40,000-₹1,41,000 would convert the range into a confirmed breakdown of the 200-day EMA.
| Key Takeaway: Gold is consolidating above the 200-day EMA after a failed rally into ₹1,45,500-₹1,46,000 supply. Demand is holding, but price is not accepting higher levels. The more significant observation is that gold absorbed a week in which the 10-year yield hit 4.69% (its highest since January 2025) and Brent crude briefly touched $100 without making new lows. That resilience suggests the correction may be finding a structural floor near the 200-day EMA, though confirmation requires acceptance above ₹1,45,500-₹1,46,000. The FOMC July 28-29 meeting is the most likely catalyst to resolve the stalemate. |
Silver | MCX SILVER1!
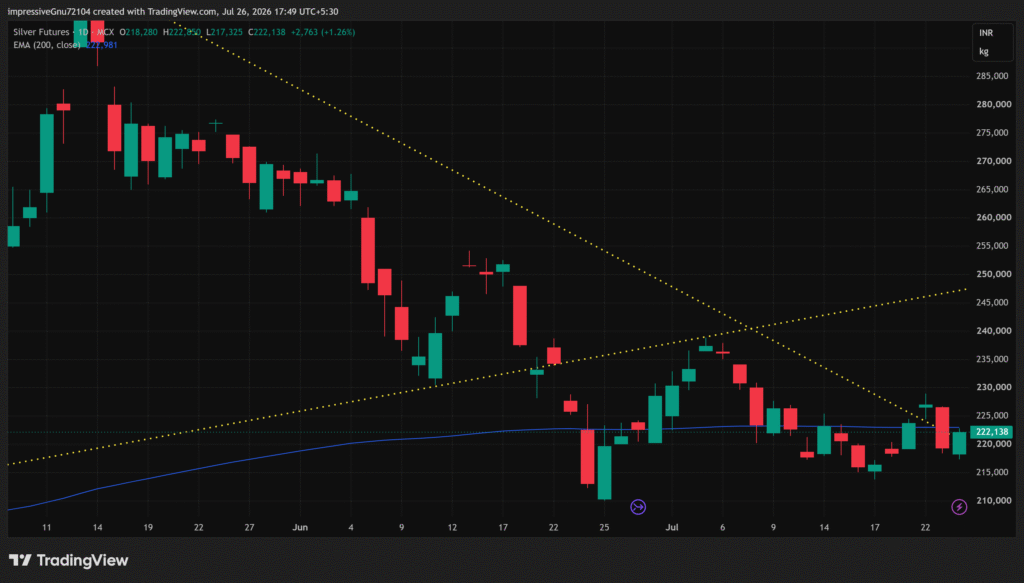
Silver is trading in a lower consolidation between approximately ₹2,15,000 and ₹2,27,000. The ₹2,15,000-₹2,18,000 area has generated repeated reactions, but the rebounds remain corrective rather than impulsive. The latest candle rose from ₹2,17,300 to close near ₹2,22,100, but its high of roughly ₹2,22,850 stopped just below the 200-day EMA at approximately ₹2,23,000. This is a test of resistance, not an accepted reclaim.
The EMA and the nearby descending yellow trendline create a concentrated supply area around ₹2,23,000-₹2,25,000. Recent attempts toward ₹2,25,000-₹2,27,000 have failed to produce sustained closes above it. The earlier compression pattern is broken and invalidated. Price remains below both the broken rising boundary and the descending trendline, while the 200-day EMA is currently acting as overhead resistance.
Pattern status: the earlier EMA breakdown remains intact, but downside momentum has compressed. A break below ₹2,15,000 would restart bearish expansion. Acceptance above ₹2,23,000-₹2,25,000 would indicate that the breakdown is beginning to fail. Silver’s position relative to gold is the defining structural divergence: gold is above the 200-day EMA and defending it as support, while silver is below the 200-day EMA and treating it as resistance.
| Key Takeaway: Silver is consolidating below the 200-day EMA, and the latest candle represents an attempted move into the ₹2,23,000-₹2,25,000 resistance area without a confirmed reclaim. The divergence with gold (above the EMA versus below it) remains the most important structural read on the pair. Like gold, silver absorbed the week’s macro shocks without making new lows, suggesting that the worst of the corrective impulse may have passed. But the 200-day EMA needs to be reclaimed, not just tested, for the recovery to carry structural conviction. |
Watch in the Days Ahead:
- FOMC July 28-29 meeting: The most important upcoming catalyst. CME FedWatch shows approximately 35% odds of a hike at the July meeting, so the base case remains a hold at 3.50-3.75%. No new Summary of Economic Projections will be released. The statement language and any post-meeting Warsh commentary will be closely parsed. A hawkish hold reinforcing the June dot-plot signal would maintain pressure on the metals. A neutral or softer hold would ease the rate-hike expectation and provide relief.
- US Q2 GDP advance estimate (July 30): The first look at second-quarter economic growth arrives the day after the FOMC decision. A strong reading would support the higher-for-longer rate path. A weaker reading would raise growth concerns and potentially shift the Fed’s calculus from inflation control toward dual-mandate balance, which would be gold-positive.
- Pakistan-mediated US-Iran talks: Friday’s report that Pakistan is mediating US-Iran talks with China’s backing was enough to push oil lower on the day. A successful resumption of diplomatic engagement would ease oil pressure, lower inflation expectations, and compress the rate-hike premium. A failure or further escalation (particularly any disruption to Red Sea shipping routes) would extend the current oil-driven inflation pressure.
- Gold at ₹1,40,000-₹1,46,000 range: A close above ₹1,45,500-₹1,46,000 would signal a constructive base forming above the 200-day EMA. A close below ₹1,40,000 would confirm a structural EMA breakdown. The FOMC is the most likely catalyst to push price out of this range.
- Silver at the 200-day EMA: MCX silver closed just below the 200-day EMA at ₹2,22,138 (EMA at approximately ₹2,23,000). A daily close above ₹2,23,000-₹2,25,000 would be the first step toward repairing the breakdown structure. Rejection at this level would confirm the EMA as resistance.
- WGC Q2 Gold Demand Trends: The report is expected before month-end. Q1 saw record central bank buying (244 tonnes). Q2 data will show whether that pace was sustained through the rate-and-oil repricing that dominated the quarter.
Disclaimer: This article is for informational purposes only and does not constitute investment or trading advice. All prices are futures closing prices, MCX in INR, COMEX in USD. Past performance is not indicative of future results.
Authored by Dhawal Chotai