


The week ending July 17 extended the correction to a fourth consecutive weekly decline. What made the move notable was not the size of the loss (both metals gave back most or all of the July 3 recovery) but the character of the weekly path. On Tuesday July 14, the US June CPI came in cooler than expected, and the initial reaction was gold-positive. That rally faded within 24 hours, and by Friday both metals were at multi-month lows. The pattern was the same one that has defined much of 2026: dovish data cannot overcome the compound weight of Iran-driven oil pressure, hawkish Fed commentary, and elevated real yields.
The dominant force through the week was the Iran-US escalation. Following the collapse of the June 17 memorandum, the US reinstated a naval blockade on Iranian ports early in the week, launched multiple strikes on Iranian targets (Central Command reported the sixth consecutive night of strikes by Friday), and President Trump warned that the US could target Iranian infrastructure if diplomatic efforts do not produce a breakthrough. Iran responded with attacks on US bases in Kuwait, Jordan, and Bahrain and instructed Yemen’s Houthi forces to prepare to disrupt Red Sea shipping. Oil moved sharply on the compounding news flow: WTI rose from near $70 at the start of the week to close above $82, a 10-14% weekly gain and the strongest weekly move in months. Brent traded above $85 by Friday. Persistent oil pressure keeps inflation expectations elevated, which pushes real yields higher, which caps gold and pressures silver more acutely because of its higher rate sensitivity.
On Tuesday July 14, US June CPI was released. Headline CPI fell 0.4% month-on-month, the largest monthly decline since April 2020, driven mainly by lower energy costs. The annual rate slowed to 3.5% from 4.2% in May, below the 3.8% consensus. Core CPI was flat month-on-month (below the expected 0.2% rise) and eased to 2.6% year-on-year (below 2.9% consensus). Services excluding energy were flat, and shelter, closely watched by Fed policymakers, rose just 0.1%. In isolation, the print was clearly dovish. But Fed Chair Kevin Warsh’s congressional testimony later that day maintained a cautious tone: he acknowledged easing headline pressures but reaffirmed the Fed’s commitment to price stability without dovish signalling. Fed Governor Christopher Waller separately made hawkish remarks that reinforced the higher-for-longer framing. The June PPI, released on Wednesday, also came in below expectations, matching the CPI’s disinflationary picture. Yet the 10-year Treasury yield stayed elevated near 4.60% and the US Dollar Index held steady near 100.97, as the market weighed backward-looking cool inflation data against forward-looking oil pressure and the Fed’s reluctance to signal cuts. CME FedWatch September hike odds eased only modestly, from around 75% pre-CPI to approximately 63% post-CPI.
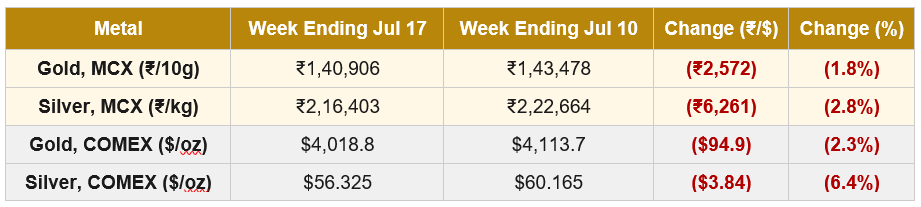
The rates-and-dollar mechanism (higher rates supporting a stronger dollar, which caps gold and silver in dollar terms) remained the dominant structural driver. The rupee weakened notably through the week, from approximately 95.37 on Friday July 10 to near 96.31 by Friday July 17, a nearly 1% depreciation. On the arithmetic, MCX prices should have declined more than COMEX in INR terms because of the currency effect. Instead, the opposite occurred: MCX gold fell 1.8% versus COMEX gold’s 2.3%, and MCX silver fell 2.8% versus COMEX silver’s 6.4%. The domestic outperformance suggests active buying at these lower price levels, an observation reinforced by the World Gold Council’s India Gold Market Update covered in Special Focus below.
Gold-specific drivers. Gold spot fell from above $4,100 on Monday to a low near $3,985 mid-week before recovering slightly to close near $4,018. The 10-year yield near 4.60% and dollar index steady near 100.97 kept the opportunity-cost pressure on the metal despite the cool CPI and PPI prints. The structural bid continued: the People’s Bank of China’s June purchase (14.93 tonnes, its 20th consecutive month) was formally reported, and Chinese official reserves now stand at approximately 75.44 million fine troy ounces. The WGC also noted that Indian gold ETFs recorded ₹34.4bn (US$356mn) of net inflows in June, the highest monthly figure since February, and that inflows continued at approximately ₹12.1bn in the first 10 days of July. For Indian holders, MCX gold’s 1.8% decline was smaller than COMEX gold’s 2.3%, despite the rupee weakening by nearly 1%. The math implies significant domestic demand-side support at these levels.
Silver-specific drivers. Silver fell 6.4% on COMEX to close near $56.32, a fresh multi-month low. The gold-silver ratio widened from around 68 to approximately 71 during the week. Silver’s higher beta to rate expectations continues to dominate the weekly narrative, and the metal is now more exposed than gold to the compound headwinds of oil-driven inflation expectations, hawkish Fed commentary, and elevated real yields. MCX silver fell only 2.8%, meaningfully less than COMEX’s 6.4%, indicating that the domestic buyer base is absorbing the international selloff at a substantially cushioned pace. The Silver Institute’s 46.3 Moz projected 2026 deficit remains a structural anchor, but the cyclical repricing continues to override it on the weekly horizon.
Gold | MCX GOLD1!
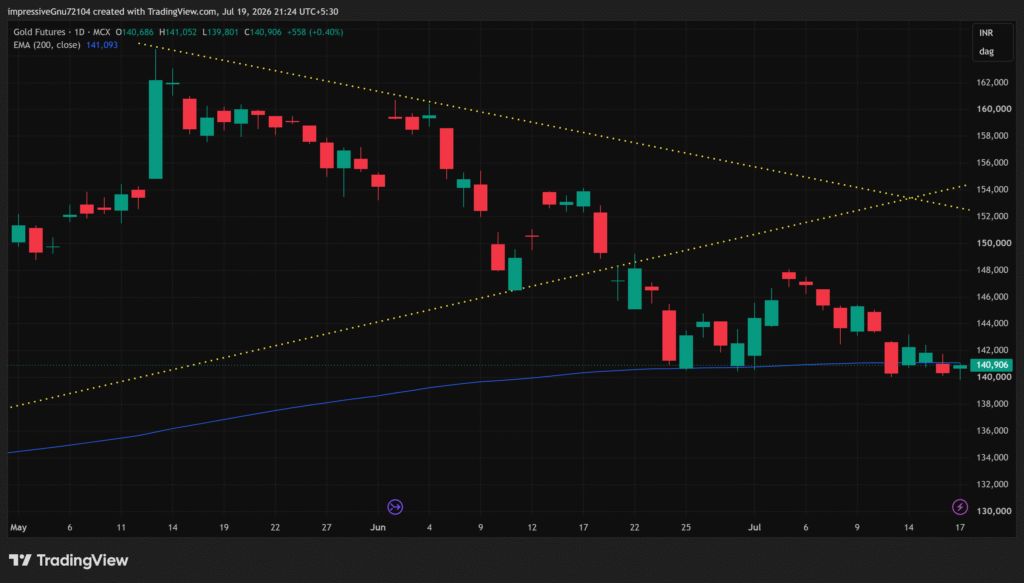
Gold remains below the broken lower rising trendline, so the earlier compression structure is still invalidated. Price is not back inside the pattern; it is in a post-breakdown phase. The key development is that the rebound from late June has failed well below the broken trendline. The recovery stalled around ₹1,47,500-₹1,48,000, then rolled over. Sellers are defending lower levels before price can even retest the larger breakdown zone.
Price is now sitting directly around the 200-day EMA near ₹1,41,100. The latest sessions show small bodies and shallow reactions rather than strong demand. Buyers are slowing the fall, but they are not producing a convincing reversal. This is not a clean downside expansion yet. Gold has marginally slipped under the 200-day EMA, but there is no decisive acceptance below ₹1,40,000-₹1,41,000. That makes the current action an EMA breakdown attempt rather than a fully confirmed long-term breakdown.
Pattern status: the compression pattern is broken and the 200-day EMA defence is weakening. A close and follow-through below ₹1,40,000 would confirm deeper weakness and expose the next demand zone. Reclaiming ₹1,43,500-₹1,45,000 would ease immediate pressure but still leave the larger structure damaged below ₹1,47,500-₹1,48,000. The 200-day EMA held decisively on the first test in late June. It is now under a more serious probe.
| Key Takeaway: Gold is in an attempted breakdown at the 200-day EMA after a failed recovery near ₹1,47,500-₹1,48,000. The structure remains bearish, but confirmation needs acceptance below ₹1,40,000-₹1,41,000 rather than just marginal closes around the EMA. For Indian market participants, MCX gold’s 1.8% decline was smaller than COMEX gold’s 2.3% despite a weaker rupee, indicating meaningful domestic buying support. The WGC India Gold Market Update released on July 14 notes that domestic discounts have narrowed sharply from the May peak, suggesting the local market is normalising even as international prices remain under pressure. |
Silver | MCX SILVER1!
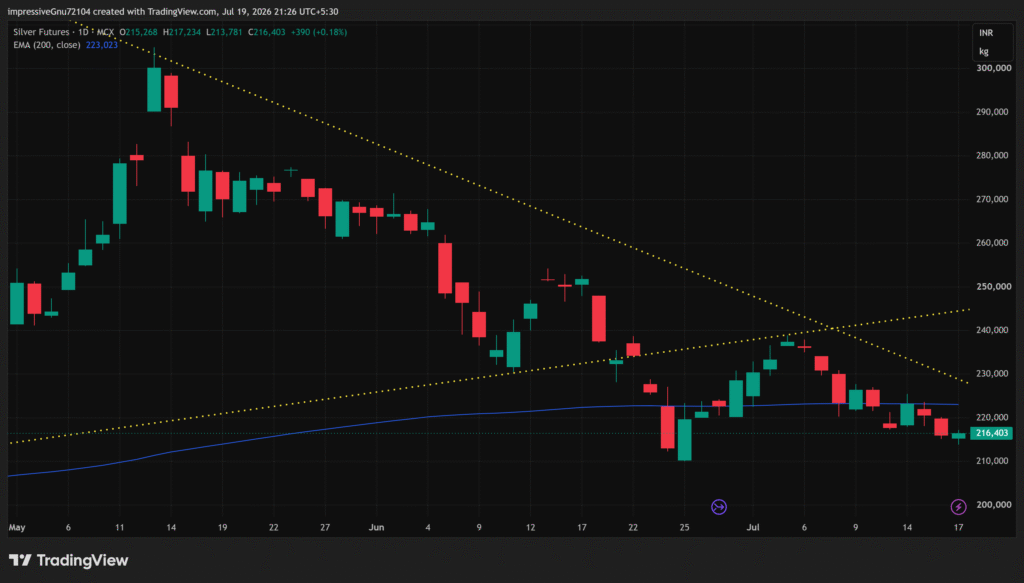
Silver is structurally weaker than gold. After bouncing from the ₹2,10,000-₹2,15,000 demand zone earlier in July, price failed near ₹2,37,000-₹2,40,000, which was the underside of the broken lower trendline and the prior support area. That failed reclaim has now produced clear downside follow-through. Silver has slipped back below the 200-day EMA near ₹2,23,000 and is trading around ₹2,16,000, showing that the EMA is no longer being cleanly defended.
Recent sessions show weak reactions from demand. The latest candle has a small bounce from the ₹2,13,000-₹2,14,000 area, but price remains below ₹2,20,000 and below the 200-day EMA. There is no evidence of a strong failed breakdown yet. Immediate demand sits around ₹2,10,000-₹2,15,000, the late-June low zone. If that breaks, the current rollover becomes a continuation leg rather than just a retest of support.
Pattern status: the compression pattern is broken and invalidated, and the 200-day EMA reclaim has failed. Silver remains bearish below ₹2,20,000-₹2,23,000, with stronger supply still overhead at ₹2,35,000-₹2,40,000. The critical asymmetry with gold is that silver has already lost its 200-day EMA while gold is still fighting on the line. Historically, silver leading the down-move suggests continued weakness in the near term unless a meaningful macro catalyst reverses the setup.
| Key Takeaway: Silver has a confirmed breakdown back below the 200-day EMA after a failed reclaim of ₹2,37,000-₹2,40,000. A reaction from ₹2,10,000-₹2,15,000 is possible, but the structure stays bearish unless price quickly reclaims ₹2,20,000-₹2,23,000. The gold-silver ratio widening toward 71 confirms silver’s underperformance. However, the MCX outperformance versus COMEX (2.8% versus 6.4%) is meaningful: it says the Indian silver buyer base is absorbing the international selloff at a much cushioned pace. That is a domestic-demand signal worth tracking. |
Special Focus | India Gold Market: Mixed Demand Signals from the WGC July Update:
On Monday July 14, the World Gold Council released its India Gold Market, which maps the trade-facing consequences of the May 13 duty hike and the June-July price decline. Several findings deserve specific attention.
The domestic discount is normalising. After the May 13 import duty hike, domestic prices traded at a peak discount of nearly US$150/oz to the landed price. That discount narrowed sharply through June and averaged approximately US$20/oz during the first two weeks of July, with domestic prices briefly trading close to parity with the landed price. The discount has widened again to approximately US$40/oz as of mid-July, reflecting ample domestic supply relative to demand. The WGC attributes this partly to the increase in old gold exchange volumes, which have added to domestic supply without requiring fresh imports.
Consumer jewellery demand has picked up. After a month-long lull from mid-May to mid-June (a seasonally slow period compounded by the price shock and Prime Ministerial appeal to limit gold purchases), consumer buying has begun to recover, led primarily by jewellery. Manufacturers are receiving order bookings from retailers in preparation for the festive season from August. In contrast, bar and coin demand has cooled, consistent with the pattern where investment buying tends to rise on price momentum rather than during pullbacks.
Listed jewellers reported a strong Q1 (April-June). Major listed jewellery retailers (Titan Company, Kalyan Jewellers, Senco Gold, and PN Gadgil) reported April-June revenue growth broadly in the high 30% to 60% year-on-year range. Growth was supported by regional festivals, the summer wedding season, and Akshay Tritiya. Demand was broad, with plain gold and studded jewellery both registering double-digit sales growth. Retailers reported growth in both customer additions and average ticket sizes, and continued store expansion (adding between 8 and 33 stores each during the quarter), which the WGC reads as an indicator of medium-term industry confidence.
The old gold exchange story is now structural. Old gold exchange for new jewellery has continued to rise since the May 13 duty hike. Retailers report exchange volumes up 10-20%, with some indicating that old gold exchanges now account for as much as 70% of jewellery sales. This is a fundamental shift in the domestic supply-demand equation: it reduces the need for fresh imports while sustaining jewellery sales through recycled metal. For the trade, this changes working capital dynamics and inventory management materially.
Investment flows are diverging by channel. Indian gold ETFs recorded a rebound in June with net inflows of ₹34.4bn (US$356mn), the highest monthly figure since February. Holdings increased by 2.2 tonnes to 119 tonnes. Investor participation broadened with 135,000 new folios added during the month, taking the total number of accounts to 12.5 million. ETF inflows continued at approximately ₹12.1bn in the first 10 days of July. Digital gold purchases through UPI also rebounded, with transaction value up 4% month-on-month to ₹25.5bn and volumes up 9% to 1.7 tonnes. Bar and coin demand cooled during the same period, reflecting the price-pullback pattern noted above.
Imports fell sharply. Gold imports weakened further in June, declining 42% month-on-month to US$1.97bn, the lowest since June 2025. Import volumes are estimated at 16-22 tonnes, down from 29 tonnes in May and 25 tonnes in June 2025. The decline reflects softer formal demand, elevated inventories in the supply chain, and the growing supply from old gold exchange. Gold’s share of total merchandise imports fell to 3% in June, well below the 17% recorded in January.
Watch in the Days Ahead:
- July 28-29 FOMC meeting: The next Fed rate decision. Base case is a hold. A hold with hawkish language would extend the current pressure on precious metals. A hold with neutral or dovish language would reopen the rate-cut conversation and support the metals via easing real yields.
- Iran situation and Strait of Hormuz: The naval blockade has been reinstated, US strikes continue, and President Trump has warned of possible strikes on Iranian infrastructure. Any material de-escalation would ease oil pressure and reduce inflation expectations. Escalation would extend the current setup. Both scenarios remain live.
- Gold at the 200-day EMA: MCX gold is sitting on the 200-day EMA at approximately ₹1,41,100. A clean close below ₹1,40,000 with follow-through would confirm the long-term structural breakdown. A reclaim of ₹1,43,500-₹1,45,000 would signal that the second EMA test is holding.
- Silver at ₹2,10,000-₹2,15,000: Silver has already lost the 200-day EMA and is testing the late-June demand zone. A break below ₹2,10,000 would be a continuation leg, not a retest. A reclaim of ₹2,20,000-₹2,23,000 would suggest the breakdown is failing.
- Q1 gold demand data (late July): The WGC’s Q2 Gold Demand Trends report is due for release in late July. Q1 saw record central bank buying (244 tonnes). Q2 data will confirm whether the structural physical bid has held through the rate-and-oil repricing.
- India festive season preparation: Manufacturers are receiving festive orders for August onwards. The WGC India update flagged strong Q1 revenues for listed jewellers. Watch for early festive demand indicators through late July as retailers begin promotional activity.
Disclaimer: This article is for informational purposes only and does not constitute investment or trading advice. All prices are futures closing prices, MCX in INR, COMEX in USD. The Special Focus section draws on data from the World Gold Council India Gold Market Update (14 July 2026), used in line with fair industry practice with citation to the World Gold Council as source. Past performance is not indicative of future results.
Authored by Dhawal Chotai