

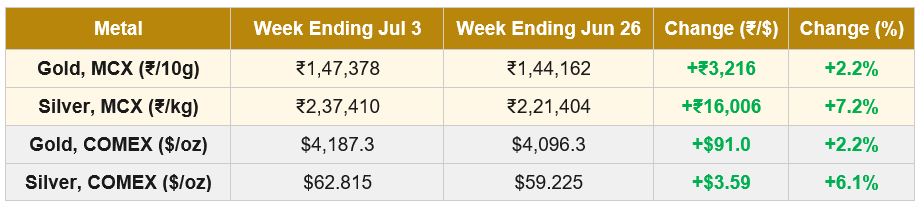
Macro Snapshot: The week ending July 3 broke a five-week decline for both gold and silver. Gold posted its first weekly gain since late May and silver led the recovery with a much larger move. The trigger was a weaker-than-expected US jobs report, which reset rate-hike expectations and pushed the dollar to its largest weekly decline since April. Layered underneath were two other significant developments: the release of the World Gold Council’s Mid-Year Outlook on Tuesday July 1 (covered in Special Focus below), and the continuation of indirect US-Iran talks in Doha.
The US June nonfarm payrolls report, released Friday July 3, showed just 57,000 jobs added, the smallest gain in four months and well below the 110,000 consensus. The unemployment rate fell to 4.2%, but for a bearish reason: workers left the labour force. Wage growth edged up to 3.5% year-on-year. The ADP private-sector report earlier in the week had also come in below expectations. Markets reacted quickly: CME FedWatch odds of a September rate hike fell from approximately 66% to around 50%, and December hike pricing declined as well. The 2-year Treasury yield fell approximately 1% on the day, with the 10-year edging lower and stabilising near 4.5%. Gold traders had positioned for continued rate-hike pressure; the weak jobs data forced a reversal of that positioning.
On the geopolitical front, the second round of US-Iran indirect talks concluded on Wednesday July 1 in Doha, focused on maritime traffic through the Strait of Hormuz and unfreezing Iranian funds. The nuclear program was not discussed and remains a separate track. According to HormuzStraitMonitor, five ships transited the strait on July 1 (compared to a pre-war average of 130), and Iran has exported more than 40 million barrels of crude since the June 17 memorandum. The next round of talks is expected after the July 9 funeral proceedings for the late Supreme Leader Ali Khamenei. The situation remains fragile, but the immediate escalation risk that dominated late June has receded.
On Tuesday July 2, Fed Chair Kevin Warsh addressed the European Central Bank Forum and noted that inflation expectations were moderating while reaffirming the central bank’s commitment to price stability. This was Warsh’s first significant public commentary since the June FOMC. Markets took the tone as marginally softer than the June dot-plot signal, though the FOMC minutes due on July 8 will provide more detail on the committee’s split views. The rates-and-dollar mechanism, which had been the dominant structural headwind for the metals through June, eased for the first time in weeks.
Gold-specific drivers: Gold spot rebounded from an eight-month low near $4,027 to touch $4,170 by Friday, its highest level since June 23. The US Dollar Index recorded its largest weekly decline since April. Gold ETF inflows were reported for the second consecutive day around July 1, and central banks added a net 41 tonnes of gold to reserves in May, according to WGC data. The rupee weakened through the week (from approximately 94.63 on Monday to 95.20 by Friday), partially offsetting the dollar weakness that supported COMEX prices. As a result, MCX gold gained 2.2% almost exactly in line with COMEX gold’s 2.2% move, meaning the currency depreciation added roughly the same amount to MCX prices as the dollar weakness subtracted.
Silver-specific drivers: Silver led the recovery in both markets: COMEX silver gained 6.1% and MCX silver gained 7.2%, well ahead of gold’s 2.2%. The gold-silver ratio narrowed sharply from approximately 70:1 at its late-June extreme back toward 66-67. The dual-engine dynamic that had made silver the greater underperformer during the correction now made it the greater outperformer during the recovery: the monetary engine benefited from the same rate-and-dollar shift that supported gold, while the industrial engine benefited from renewed risk-on sentiment following the weak jobs data (a signal of Fed patience rather than tightening). Silver ETFs also saw inflows. The Silver Institute’s structural deficit thesis for 2026 (46.3 Moz) remains intact; the recovery does not require a structural narrative change, only a repricing of the monetary premium that had been compressed too far.
Gold | MCX GOLD1!
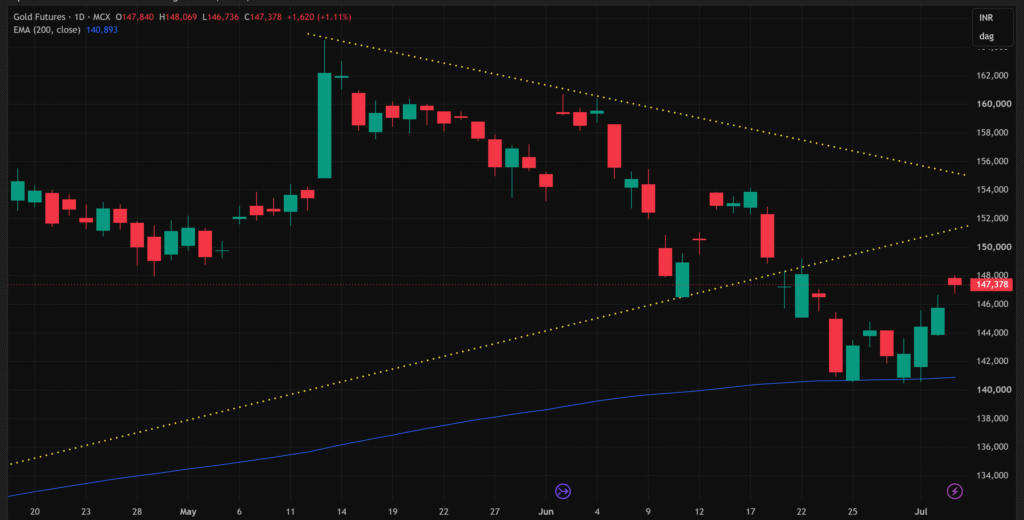
Gold has bounced sharply from the 200-day EMA area after the late-June selloff, moving from approximately ₹1,41,000 back toward ₹1,47,000-₹1,48,000. The 200-day EMA is still being defended, which is the most important structural fact of the current chart. But the recovery is now approaching its first real test.
The lower rising trendline has already been broken, so the earlier compression pattern is not intact. The current move should be read as a post-breakdown recovery, not as price still trading cleanly inside the pattern. The key question is whether gold can reclaim the broken structure. The first supply zone is ₹1,47,500-₹1,48,500, followed by the more important ₹1,49,500-₹1,51,500 area where the broken lower trendline and prior breakdown region come into play.
Short-term momentum has improved: the bounce from the 200-day EMA is not weak or sideways; it has produced a clear sequence of higher recovery candles. However, price has not yet reclaimed the broken trendline, so the broader structure remains damaged. A reclaim above ₹1,49,500-₹1,51,500 would suggest the breakdown is failing; rejection below that zone would keep the bearish breakdown structure active. The 200-day EMA defense is a necessary but not sufficient condition for reversal.
| Key Takeaway: Gold is bouncing constructively from the 200-day EMA, but the recovery has not yet reclaimed the broken lower trendline. The current move reads as a corrective recovery or possible failed breakdown attempt at the 200-day EMA. Confirmation of a genuine reversal requires acceptance above ₹1,49,500-₹1,51,500. Rejection at overhead resistance would leave the breakdown structure intact. For Indian market participants, the rupee weakened even as global dollar strength eased, and MCX gold’s 2.2% gain matched COMEX exactly rather than benefiting from a currency cushion. The duty-and-rupee mechanic has now cut both ways since early June. |
Silver | MCX SILVER1!
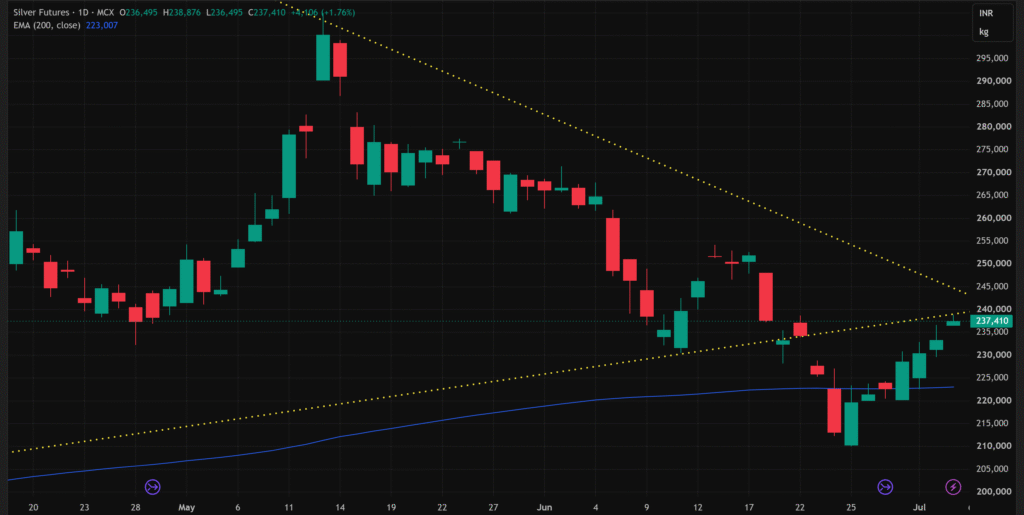
Silver has staged a stronger recovery than gold. Price briefly broke below the 200-day EMA in late June, but the breakdown did not hold; the metal has now reclaimed the EMA and is trading back near ₹2,37,000. The bounce from the ₹2,10,000-₹2,15,000 demand zone was impulsive, showing a clear demand reaction rather than continued downside acceptance.
Price is now testing the underside of the broken lower yellow trendline and prior support area around ₹2,37,000-₹2,40,000. This is the immediate decision zone: reclaiming it would weaken the breakdown case, while rejection here would confirm the trendline as supply. The broader structure is still not repaired. Silver remains below the descending upper trendline and below the larger ₹2,45,000-₹2,52,000 supply region, where the prior recovery attempt failed in mid-June.
Pattern status: the compression pattern is broken, but the breakdown below the 200-day EMA has failed for now. Silver is attempting to reclaim the broken lower trendline; success above ₹2,40,000 would open room toward ₹2,45,000-₹2,52,000, while rejection would keep the post-breakdown structure bearish. The gold-silver ratio compression from 70:1 back toward 66-67 has been the cleanest expression of silver’s recovery leadership. Whether that leadership continues depends on whether the risk-on impulse extends or fades at the first real resistance.
| Key Takeaway: Silver is showing a failed breakdown below the 200-day EMA and an attempted reclaim of the broken lower trendline. Short-term momentum has improved and the ratio narrowing from 70:1 toward 66-67 confirms silver’s recovery leadership. But the broader structure remains unconfirmed until price accepts above ₹2,37,000-₹2,40,000 and then challenges ₹2,45,000-₹2,52,000. Silver led the fall, and silver has led the bounce; both moves are consistent with the metal’s higher beta to macro repricing. The industrial deficit thesis remains structurally intact but has not yet been the driver of the recovery. |
Special Focus | The WGC Mid-Year Outlook: Point Break at $4,100
The World Gold Council released its Gold Mid-Year Outlook 2026 on Tuesday July 1. The report is titled Point Break and frames gold as trading at what the WGC calls a fair-value zone for current macro conditions, with a clearly defined set of scenarios that could push it up or down from here.
The base case: If current macro conditions do not materially change, the WGC estimates gold may trade within ±5% of approximately US$4,100 per ounce through the second half of 2026. The base case assumes at least one Fed rate hike (likely by October), parallel tightening from the Bank of England, Bank of Japan, and European Central Bank, US inflation peaking near 3.9% in Q2, and global growth of 2.9% year-on-year. Gold’s current price is broadly consistent with this consensus.
The upside case: Three catalysts could push gold higher from here. First, worsening economic or geopolitical conditions that increase safe-haven demand. Second, a reversal in interest-rate expectations toward cuts, which would compress real yields and the dollar. Third, sustained long-term investor participation from sovereign wealth funds, insurance companies (a Chinese pilot programme now permits some insurers to invest in gold), and pension funds. Under a favourable combination of these catalysts, gold could resume its upward trend toward US$4,500 per ounce, with US$5,000 possible only on a strong, clear signal.
The downside case: Three factors could push gold lower. First, US dollar strength and interest rates rising more than currently expected. Second, sustained risk-on sentiment as investors move from safe-haven to growth allocations. Third, technical breakdown below the psychological US$3,860 level, which the WGC identifies as a next-line technical support. Under this scenario, gold could decline 10-15%. However, the WGC notes that historical drawdowns of that magnitude have consistently attracted organic demand from consumers, central banks, and long-term investors across multiple geographies.
Beyond the macro base: two structural wildcards. The WGC identifies two market segments that can influence gold’s performance beyond the macroeconomic scenarios. Central banks have bought an average of 1,000 tonnes per year since 2022. The Central Bank Gold Reserves Survey 2026 (released in June) confirmed that a record 45% of central banks plan to increase their own holdings over the next 12 months. WGC analysis suggests that a 20-25 tonne incremental increase in central bank purchases above the long-term average translates to approximately a 1% increase in the gold price. The second wildcard is India, where the May 13 duty hike is projected to reduce demand by 50-60 tonnes (approximately 10% year-on-year), an effect the WGC believes is now largely priced in but which could deepen if the domestic economy decelerates.
The Asian trading session anomaly. One of the most notable findings in the report is that gold’s performance in H1 2026 was almost entirely determined by trading activity in Asian and US sessions. The Asian session accounted for +12.97% of gold’s year-to-date return, the European session was slightly negative at -1.32%, and the US session was heavily negative at -15.08%. The WGC frames this as evidence of the growing structural role of Asian investors and consumers in global gold price discovery. For a publication whose audience sits at the heart of one of those markets, this is a notable data point.
Watch in the Days Ahead:
- FOMC minutes (July 8): The minutes from the June 17 FOMC meeting will detail the split views behind the raised dot plot and provide colour on how the committee thinks about the balance between still-elevated inflation and softening labour data. Any indication that the median hawkish dot is not widely held would extend the recent rate-repricing tailwind for gold.
- Iran-US next talks (after July 9): The Doha talks concluded without breakthrough on the nuclear file. The next round is scheduled after the July 9 funeral proceedings for Ali Khamenei. Progress on maritime traffic and unfrozen funds would extend the current de-escalation. A collapse would reintroduce the geopolitical premium and lift oil, both of which would support gold via different transmission channels.
- Gold at the broken trendline retest: MCX gold needs to clear ₹1,49,500-₹1,51,500 for the recovery to be treated as more than a corrective bounce. Rejection at that zone would leave the 200-day EMA as a re-testable structural support level rather than a confirmed floor. A clean reclaim would put the earlier ₹1,53,000-₹1,54,000 supply zone back in play.
- Silver at ₹2,37,000-₹2,40,000: This is silver’s equivalent decision zone. Acceptance above it opens the path toward ₹2,45,000-₹2,52,000. Rejection would put the metal back into a broader consolidation. The gold-silver ratio at 66-67 will indicate whether silver’s recovery leadership continues.
- Rupee direction: The rupee weakened from 94.63 to 95.20 over the week ending July 3, even as the dollar declined against major currencies globally. The idiosyncratic rupee weakness reflects month- and quarter-end dollar demand and continued safe-haven flows. If the rupee stabilises or strengthens, MCX gains will lag COMEX gains. If it continues weakening, MCX will outperform on the upside but underperform on the downside.
- Central bank May data: WGC data showed 41 tonnes of net central bank buying in May, continuing the structural demand story that underpins the medium-term thesis. Further monthly data through Q3 will indicate whether the pace has sustained.
- India gold market infrastructure: Artha Bharat Investment Managers launched the Artha Bharat FinMet Physical Gold Fund on July 3, the first physical commodity fund and the first gold fund authorised by IFSCA from GIFT City. The scheme allocates at least 95% of assets to LBMA-standard bars traded on the India International Bullion Exchange and offers weekly subscriptions with either cash or physical gold redemption. This is not an immediate price catalyst, but it is a meaningful structural addition to India’s institutional gold investment infrastructure at a moment when duty policy has constrained conventional imports.
Disclaimer: This article is for informational purposes only and does not constitute investment or trading advice. All prices are futures closing prices, MCX in INR, COMEX in USD. The Special Focus section draws on data from the World Gold Council Gold Mid-Year Outlook 2026 (released 1 July 2026), used in line with fair industry practice with citation to the World Gold Council as source. Past performance is not indicative of future results.
Authored by Dhawal Chotai
