


Macro Snapshot: The week ending August 21 was defined by two opposing forces. On Tuesday the 30-year Treasury yield touched 5.34%, its highest reading since 2007. On Wednesday the Treasury Department announced it would at least double its liquidity-support buybacks of 10 to 30-year securities; hours later, FOMC minutes from July 28 to 29 showed many participants judged further tightening would likely be necessary if inflation did not decline. On the same day, US federal debt crossed $40 trillion, only five months after eclipsing $39 trillion. Long-dated yields fell hard on the Bessent announcement then largely reversed: the 10-year closed Friday near 4.74% and the 30-year near 5.27%, both marginally above the prior Friday’s 4.69% and 5.21%. The dollar index could not recover, ending near 98.77 close to a three-month low. CME FedWatch priced roughly 68% hold and 32% hike for the September 16 meeting.
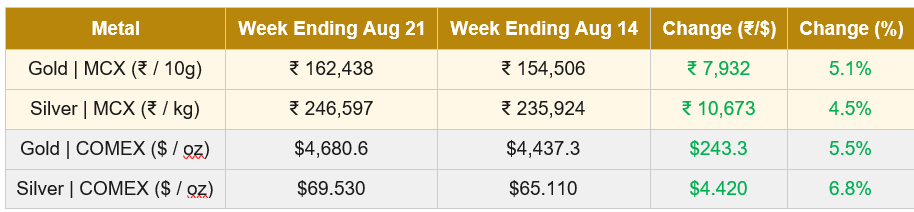
The rupee traded in a narrow band, 95.51 to 95.79 per US dollar per MTFX data, closing near 95.74 on Friday against the prior Friday’s 95.61 as RBI dollar sales and higher oil offset the brief dollar weakness on the Treasury news. For MCX metals the rupee neither cushioned nor amplified: the 5.5% COMEX gold gain flowed through to a 5.1% MCX move and the 6.8% COMEX silver gain to 4.5%. Brent closed near $94.04, up about 6% for a second consecutive weekly gain, and WTI near $86.78, up about 5%. The catalyst was preparations for what Treasury Secretary Scott Bessent described as sweeping sanctions against Iran (President Trump called it ‘economic D-Day’), alongside the UAE cutting all economic and financial ties with Tehran after accusing Iran of firing missiles at UAE territory.
Gold-specific drivers: Gold logged a fifth consecutive weekly gain, its longest winning streak since October 2025. The core catalyst was the Treasury actively suppressing long-dated borrowing costs at the same moment federal debt crossed $40 trillion, a combination that reintroduced the debasement premium into pricing. Central bank buying continues quietly (Bloomberg reported the PBoC has now accumulated gold for 21 consecutive months, and Poland led Q2 buying with 51 tonnes). Domestically, the WGC on August 19 flagged strengthening jewellery demand as deferred purchases returned, though CNBC-TV18 noted that the push above ₹1.60 lakh had already begun denting retail buying at these price levels.
Silver-specific drivers: Silver participated fully. COMEX silver closed at $69.53, a 6.8% weekly gain and third consecutive advance, compressing the gold-silver ratio from roughly 68 to roughly 67. The structural setup is unchanged: the Silver Institute’s World Silver Survey 2026 projects a sixth consecutive year of supply deficit at 46.3 million ounces, against a mine supply base where more than 70% comes as by-product and does not respond to higher prices. What made the week distinctive was that silver’s monetary and industrial engines pulled together, and both channels drove the ratio compression.
Gold | MCX GOLD1!
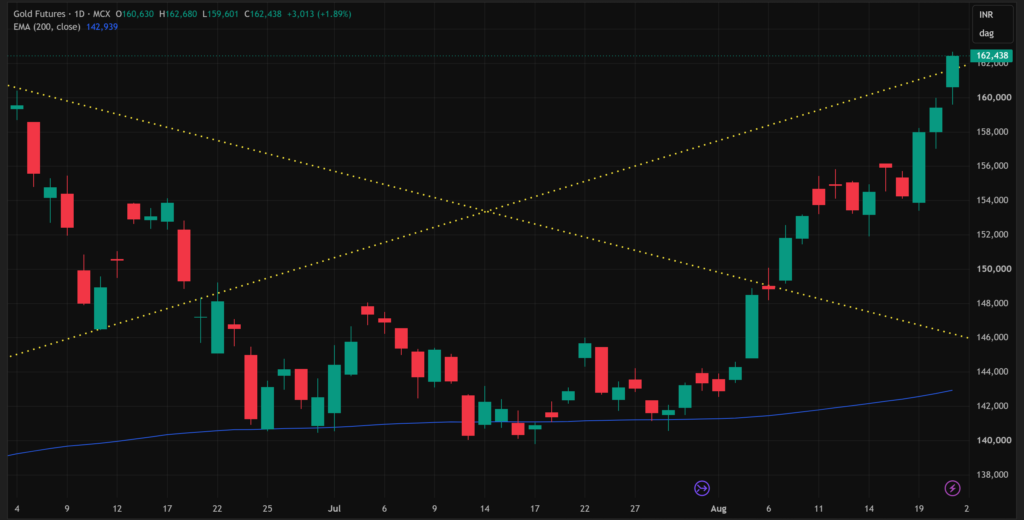
Gold has moved into a full expansion phase, not a tentative recovery. Price has advanced from the July base near ₹140,000 to ₹142,000 to a Friday close of ₹162,438, more than ₹19,000 above the 200-day EMA. The most important feature of the sequence is the acceleration through the ₹154,000 to ₹156,000 consolidation zone. That area had earlier acted as a reaction ceiling; instead of producing rejection, price broke through and expanded sharply toward ₹162,000. Successive large bullish candles indicate demand is not merely absorbing supply; buyers are actively repricing the market higher. Friday traded from ₹159,601 to ₹162,680 and closed at ₹162,438, essentially at the high with no meaningful upper wick.
That is high-quality close behaviour at a new high, and the immediate risk is no longer confirmation; it is extension. A shallow pullback into ₹160,000 to ₹161,000 would be constructive because it would show the market can absorb profit-taking without giving up the breakout. Below that, ₹157,500 to ₹159,000 becomes the more meaningful short-term demand zone. A deeper return toward ₹154,000 to ₹156,000 would indicate momentum has cooled considerably but would not destroy the broader bullish structure. On the upside, ₹162,680 is the immediate reference; there is limited recent price history above it on this chart, meaning the market may enter genuine price discovery rather than encountering a defined historical ceiling. A close above ₹162,700 followed by further closes near the highs favours continuation; a large reversal candle from this area followed by a close below ₹159,000 to ₹160,000 would be the first meaningful evidence that vertical acceleration is being absorbed.
| Key Takeaway: Gold is in confirmed expansion, not accumulation. The rally is fundamentally supported (fiscal debasement, dollar weakness, central bank buying) but stretched in the short term. For the Indian trade, the practical implication is that the rupee has not amplified this move; MCX gains are almost fully explained by COMEX. Inventory decisions ahead of the festive stocking cycle now hinge on whether ₹160,000 becomes a new base or the market gives back a portion of the vertical move. |
Silver | MCX SILVER1!
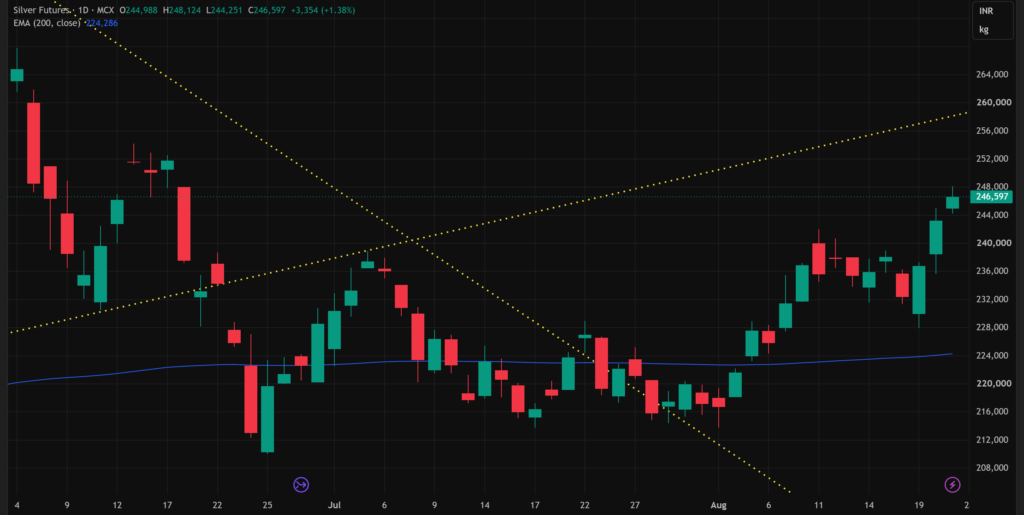
Silver is also in a clear bullish expansion phase, but the chart structure differs from gold. Price has advanced from the ₹215,000 to ₹220,000 base of late July and early August, moving decisively through the earlier ₹236,000 to ₹240,000 reaction zone to close at ₹246,597. The 200-day EMA at ₹224,286 was not simply pierced and lost again; the market spent time establishing above it before accelerating, so the EMA now functions as structural support. The descending trendline has been broken; after crossing it around ₹223,000 to ₹226,000, silver built a base, reclaimed the EMA, and produced a sustained series of higher highs. Unlike gold’s more vertical sequence, silver paused meaningfully around ₹236,000 to ₹240,000 before resuming, which is constructive.
Friday’s candle was bullish but its close quality was slightly less emphatic than gold’s. Silver traded up to ₹248,124 and closed at ₹246,597, leaving a modest upper wick that suggests some supply above ₹247,000 to ₹248,000. The reaction is too small to classify as rejection; buyers still closed comfortably above ₹246,000. ₹248,000 to ₹250,000 is now the first major decision zone, combining the current high area with the rising trendline overhead. A sustained close above ₹250,000 would open ₹252,000 to ₹255,000. Support sits at ₹242,000 to ₹244,000; losing ₹236,000 to ₹240,000 would question whether the move is transitioning from impulsive advance into a larger correction.
| Key Takeaway: Silver is confirming, not lagging: the gold-silver ratio compressed from roughly 68 to roughly 67 across the week, and the third consecutive weekly gain establishes a clean uptrend. The next test is ₹248,000 to ₹250,000, where horizontal resistance and rising trendline resistance converge. A clean break through that band would be the more meaningful technical event, because it would confirm silver is participating structurally in the debasement trade rather than mechanically tracking gold. |
Special Focus: WGC India Gold Market Update:
The WGC published its India gold market update on August 19, authored by Kavita Chacko. The report identifies a clear improvement in domestic conditions after the sharp June correction: LBMA gold rose 9% in the first two weeks of August to $4,391/oz, while MCX spot gold gained roughly 7% to ₹151,744/10g through August 14, with mild rupee appreciation limiting the domestic move.
The strongest signal came from imports. July gold imports rose to $4.16 billion, more than double June’s $1.97 billion, with volumes estimated at 40 to 45 tonnes versus 20 tonnes in June, the clearest evidence yet of festive inventory replenishment. Gold ETF inflows continued at a slower pace: July net inflows of ₹15.6 billion ($163 million) lifted holdings by 1 tonne to 120 tonnes, with AUM at ₹1,733 billion; the first two weeks of August added another ₹11.79 billion. MCX average daily gold futures volumes recovered to 14.9 tonnes in July from 13.5 tonnes across the prior three months, still 59% below January’s peak but 35% higher year-on-year in turnover, reflecting higher price levels.
Watch in the Days Ahead:
- Jackson Hole (August 27 to 29): Chair Warsh is expected to speak. Under his no-forward-guidance framework, this is the most substantive on-record signal until the September 16 FOMC. A tone that reinforces the July minutes pressures gold; softening extends the rally.
- July PCE and Q2 GDP (August 26): A hotter PCE raises September hike odds given the minutes’ hawkish tilt; a softer print consolidates the 68% hold, 32% hike split now priced by CME FedWatch.
- US Iran sanctions (Monday, August 24): Bessent has said details land Monday. Broader third-country measures, particularly those affecting China as the largest buyer of Iranian crude, would extend Brent and reinforce gold’s inflation channel.
- Gold technical levels: Support ₹160,000 then ₹157,500 to ₹159,000; deeper ₹154,000 to ₹156,000. Sustained trade above ₹162,700 confirms continuation into price discovery.
- Silver technical levels: First decision zone ₹248,000 to ₹250,000 (horizontal plus rising trendline); next reaction ₹252,000 to ₹255,000. Support ₹242,000 to ₹244,000.
- Long-end Treasury behaviour: The 30-year closed near 5.27% on Friday, above the prior 5.21% despite the buyback. A push back toward 5.34% strengthens the debasement narrative.
Disclaimer: This column is prepared for informational purposes only. It reflects the author’s reading of market data as of the publication date and does not constitute investment advice, a solicitation, or a recommendation to buy or sell any commodity, security, or financial instrument. Readers should conduct their own due diligence and consult qualified professionals before acting on any information contained here.
Authored by Dhawal Chotai