


Macro Snapshot: The week ending July 10 unwound most of the recovery from the prior week. Gold gave back the majority of the July 3 bounce and silver gave back even more, with silver again showing the higher beta that has defined its behaviour on both sides of the correction. Both metals are back at the 200-day EMA area that held in late June: gold is still marginally above the line, silver has slipped just below it. Two macro shocks drove the reversal, and the direction of both is unresolved.
The first was the collapse of the June 17 US-Iran memorandum of understanding. On Monday July 6, three oil tankers were reported struck in the Strait of Hormuz. On Tuesday July 7, the US military launched a new wave of strikes on Iranian targets. On Wednesday July 8, at the NATO summit in Ankara, President Donald Trump declared the ceasefire “over”, and Iran said no further peace talks would occur unless US strikes ceased. Brent crude briefly surged more than 5% before settling higher on the week. This is the same transmission mechanism that has defined 2026: oil spike leads to higher inflation expectations, which raises Fed rate-hike probability, which raises real yields, which pressures precious metals. The safe-haven bid for gold was not enough to offset the rates channel.
The second was the release of the June 16-17 FOMC minutes on Wednesday July 8. The minutes confirmed a committee split 9-8-1 on 2026 policy: nine members projected at least one rate hike, eight projected no change, and one projected a cut. Chair Kevin Warsh withheld his own dot for the first time by any Fed chair since the dot plot began in 2012, and the statement was compressed to 130 words with no forward guidance. The staff economic projections revised core PCE up (from 2.7% to 3.3%) and GDP growth down (to 2.2%). The market read the minutes as marginally hawkish: CME FedWatch odds of a September rate hike shifted from approximately 50% at the start of the week to around 60% by Wednesday evening. The 10-year Treasury yield rose to 4.567% (from 4.376% at the July 3 close), and the US Dollar Index recovered from below 100 to near 101.
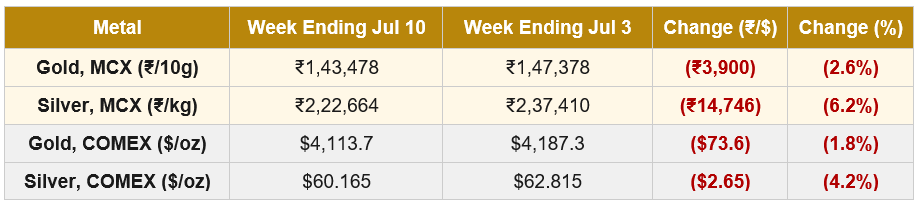
The rates-and-dollar mechanism (higher rates lead to a stronger dollar which leads to lower dollar-denominated gold and silver prices) reasserted itself as the dominant weekly driver. The rupee weakened progressively through the week, from approximately 95.18 on Friday July 3 to near 95.55 by Friday July 10, adding roughly 0.4% to the INR-denominated decline in metals prices. That is why MCX declines exceeded COMEX declines on both metals for the second week running.
Gold-specific drivers. Gold spot fell from its two-week high above $4,200 on Monday July 6 to close near $4,113 on Friday. The Iran escalation was initially met with a modest safe-haven bid, but the rise in real yields (via the oil-inflation-rate channel) dominated. Central bank buying continued as a structural support: the People’s Bank of China added 14.93 tonnes in June, extending its buying streak to 20 consecutive months and its largest single-month purchase since 2023. Official Chinese gold reserves now stand at approximately 75.44 million fine troy ounces. JPMorgan lowered its Q4 2026 gold forecast to $4,500 (from $6,000), while maintaining a medium-term bullish stance. For Indian holders, the rupee weakness explained why MCX gold’s 2.6% decline exceeded COMEX gold’s 1.8%. The duty-and-rupee mechanic has now moved with the international tape for three consecutive weeks.
Silver-specific drivers. Silver fell 4.2% on COMEX and 6.2% on MCX, more than twice gold’s decline in each market. The gold-silver ratio widened from 66-67 at the July 3 close back toward 68-69 by Friday. Silver’s higher beta on the recovery (the prior week) turned into higher beta on the reversal, confirming that macro positioning, rather than physical supply-demand, remains the dominant weekly driver. Peter Grant of Zaner Metals summed up the shift after the FOMC minutes: “The reality is setting in that the Fed is still very much focused on reining in inflation, so higher-for-longer still seems the most likely Fed path.” The Silver Institute’s 46.3 Moz projected 2026 deficit remains structurally intact, but the near-term monetary premium continues to be compressed by rate-cycle expectations.
Trade voice on India’s H2 outlook. Colin Shah, Managing Director of Kama Jewelry and former Chairman of GJEPC, published a perspective note during the week. His view: gold is positioned in “an extremely sensitive place where it shows a promising sign of staying range-bound in H2 CY26”, but “even a minor economic trigger can lead to major price disruption”. On Indian demand, he expects the festive season to “support demand” but with buyers favouring “purpose-led, smaller purchases, rather than large investments”. Overall sentiment is neutral to cautious. This trade view aligns closely with the World Gold Council’s Mid-Year Outlook base case of $4,100 ± 5% for H2 2026, released the prior week.
Gold | MCX GOLD1!
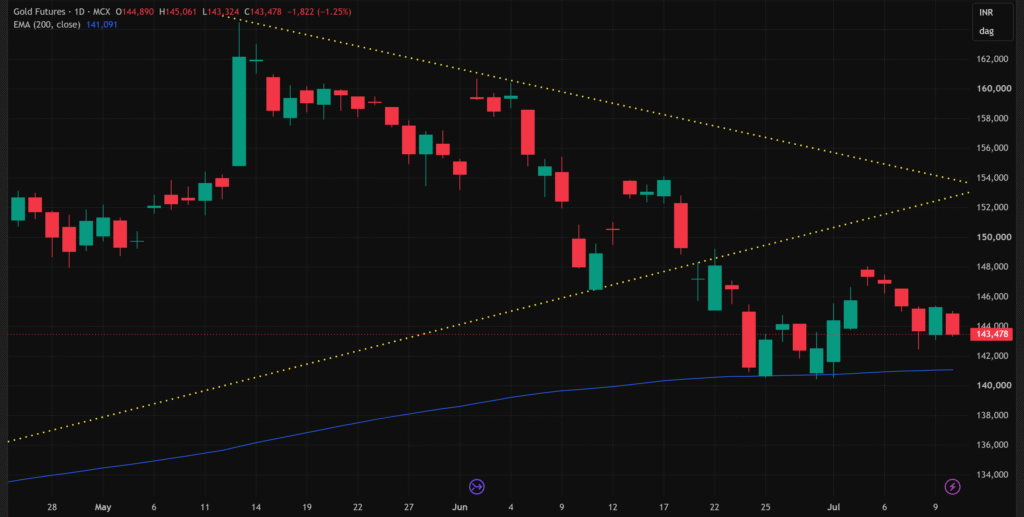
Gold remains in a post-breakdown recovery structure, not a repaired bullish structure. The lower rising trendline was broken during the June decline and price is still trading well below it. The old compression pattern is invalidated. The key technical event of the week was the failed recovery near ₹1,47,500-₹1,48,000. Price bounced from the 200-day EMA area in late June and moved higher, but that recovery stalled before even reaching the underside of the broken trendline. Sellers stepped in earlier than would be ideal for a genuine reversal.
The last several sessions show fading upside momentum: lower highs, small-bodied hesitation, and now a red candle closing near ₹1,43,500. This means the 200-day EMA defense is being retested indirectly rather than confirmed as a durable floor. The 200-day EMA near ₹1,41,100 remains the key demand reference. Gold is still above it, so this is not yet a long-term EMA breakdown, but price is drifting back toward that zone without strong upside follow-through.
Pattern status: the compression pattern is broken and invalidated. Current structure remains bearish below ₹1,47,500-₹1,48,000, with the larger breakdown pressure intact unless gold reclaims ₹1,49,500-₹1,51,500. This is now the second test of the 200-day EMA in three weeks. The first test held. The character of the second test will indicate whether the 200-day is a durable structural floor or a level that will eventually give way to a deeper corrective phase.
| Key Takeaway: Gold is in a confirmed breakdown below the lower rising trendline but only an attempted breakdown toward the 200-day EMA. The 200-day EMA is still holding, but the failed bounce below ₹1,48,000 keeps the short-term bias weak. The move becomes structurally more concerning if the 200-day EMA fails on this second test. For Indian market participants, the rupee weakened for the third week in a row, and MCX gold’s 2.6% decline exceeded COMEX gold’s 1.8%. The duty-and-rupee cushion has now consistently moved with the international tape rather than absorbing it, a meaningful shift from the earlier post-duty-hike pattern. |
Silver | MCX SILVER1!
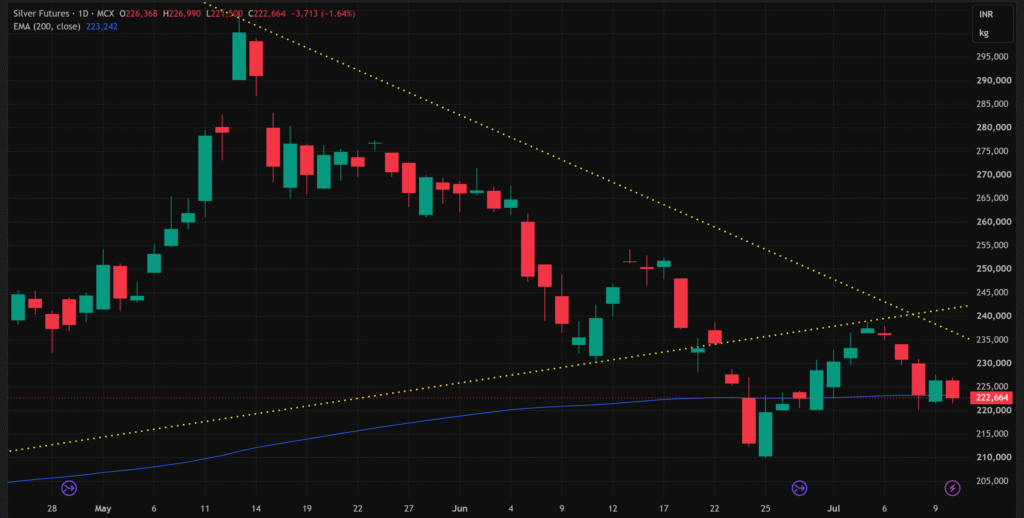
MCX Close (July 10): ₹2,22,664 per kg Prior week (July 3): ₹2,37,410 Change: (₹14,746) (6.2%) | ATH: ~₹4,20,000 200 EMA: ~₹2,23,200
Silver’s recovery attempt weakened materially. The bounce from the ₹2,10,000-₹2,15,000 demand zone reclaimed the 200-day EMA briefly at the start of the week, but price failed near ₹2,37,000-₹2,40,000 and has now slipped back toward the EMA. The rejection from the ₹2,37,000-₹2,40,000 zone is the key technical event of the week. That zone was the underside of the broken lower trendline and prior support area, and price could not accept above it. This confirms the recent recovery as a retest, not a reversal.
The last several sessions show sellers regaining control: after the failed reclaim, silver printed a lower-high sequence and is now closing near ₹2,22,600, slightly below the 200-day EMA at approximately ₹2,23,200. The ₹2,20,000-₹2,23,000 band is the immediate decision zone. A quick reclaim would leave this as a marginal EMA undercut. Acceptance below ₹2,20,000 would expose the prior ₹2,10,000-₹2,15,000 demand area again.
Pattern status: the compression pattern is broken and invalidated, and the 200-day EMA reclaim is now failing. Silver has not yet produced a clean downside expansion below ₹2,20,000, but the structure has turned bearish again. Compared to gold, silver has already given up its 200-day EMA (marginally), which puts it in a more damaged short-term position. The gold-silver ratio widening from 66-67 back toward 68-69 confirms silver’s renewed underperformance.
| Key Takeaway: Silver is in an early breakdown back below the 200-day EMA after a failed reclaim of ₹2,37,000-₹2,40,000. The move becomes more convincing if price accepts below ₹2,20,000. Reclaiming ₹2,25,000-₹2,30,000 would reduce immediate downside pressure. Silver led the fall in June and led the bounce in early July. It is now leading the retest of the lows. Traders should treat the ratio widening back toward 68-69 as confirmation that macro positioning is still the dominant driver, and the industrial deficit story remains a medium-term thesis rather than a weekly catalyst. |
Special Focus | Hong Kong Builds the Infrastructure for Asian Gold Price Discovery
One of the more significant structural developments of the week did not appear in the headline macro news. On Tuesday July 7, Hong Kong launched a central gold clearing and settlement system operated by the government-owned Hong Kong Precious Metals Central Clearing Company. The system is backed by 11 major banks. On the same day, a “Delivery Connect” scheme with the Shanghai Gold Exchange went live, creating a direct pipeline for physical gold settlement between Hong Kong’s over-the-counter market and mainland China. A new Hong Kong gold benchmark called the HAU price simultaneously launched on Bloomberg.
Why this matters. The World Gold Council’s Mid-Year Outlook 2026 (released the prior week) identified one of the most striking data points in the first-half performance analysis: Asian trading sessions accounted for +12.97% of gold’s year-to-date return, while US sessions accounted for -15.08% and European sessions for -1.32%. The WGC framed this as evidence of the growing structural role of Asian investors in global gold price discovery. Hong Kong’s new clearing infrastructure is the physical-market equivalent of that price-discovery shift: institutional plumbing that allows large-scale settlement to occur in Asian time zones with Asian benchmarks.
The strategic context. Chinese demand has been one of the defining structural stories of 2026. The People’s Bank of China extended its gold buying streak to 20 consecutive months in June, adding 14.93 tonnes (the largest single-month purchase since 2023). Chinese official reserves now stand at approximately 75.44 million fine troy ounces. Beyond official demand, Chinese consumer and institutional gold demand has been consistently strong. Hong Kong’s new clearing system, combined with the Delivery Connect scheme to the Shanghai Gold Exchange, creates infrastructure that could allow Asian institutional buyers to bypass the London-New York settlement duopoly that has historically dominated the physical gold market.
Implications for the Indian market. India is one of the two largest gold consumer markets in the world, and the WGC’s Mid-Year Outlook specifically identified the Indian market as a structural factor that could shape global gold price discovery in the second half. The May 13 duty hike has compressed India’s formal import channels, but institutional infrastructure like the India International Bullion Exchange in GIFT City (which recently added its first physical gold fund) is part of a longer-term shift toward Asian-hemisphere price discovery. Hong Kong’s move is part of the same broader trend. For Indian trade participants, the practical implication is that Asian benchmarks and Asian trading-session dynamics are likely to matter more for physical gold pricing than they have historically.
Sources: CNBC, USAGOLD, and Commerzbank market reports covering the Hong Kong Precious Metals Central Clearing Company launch (7 July 2026), Delivery Connect scheme with Shanghai Gold Exchange, and HAU benchmark. PBoC data from the People’s Bank of China. Contextual framing draws on the World Gold Council Gold Mid-Year Outlook 2026 (1 July 2026).
Watch in the Days Ahead:
- June US CPI (July 14): The June inflation print is the most consequential data release in the days ahead. A higher-than-expected reading would confirm the FOMC minutes’ hawkish tone and lock in the September hike case, further pressuring gold and silver. A soft print would re-open the rate-cut conversation and provide relief. Consensus expectations put headline CPI near 4.2%.
- Warsh testimony (July 14, 90 minutes after CPI): Fed Chair Warsh is scheduled to testify shortly after the CPI release. His characteristically brief communication style may leave more questions than answers, but his framing of the inflation-versus-employment balance will be closely parsed. This is a rare same-day combination of data and Fed commentary.
- Iran-US diplomatic status: With the ceasefire declared over and no talks scheduled, the geopolitical risk premium is now open-ended. Further Strait of Hormuz incidents would extend oil’s move, keep real yields elevated, and pressure the metals via the transmission mechanism seen in the week ending July 10. A surprise return to the negotiating table would produce the opposite.
- Gold’s second 200-day EMA test: MCX gold at ₹1,43,478 sits just above the 200-day EMA at approximately ₹1,41,100. A close below the EMA would be the first structural failure of that support in the entire correction. A hold and recovery from this zone would suggest the 200-day is a genuine durable floor. This is the single most important technical event to monitor.
- Silver reclaim attempt: MCX silver is trading just below the 200-day EMA. A reclaim of ₹2,25,000-₹2,30,000 would keep the recent bounce alive. Rejection would confirm the reversal and put the ₹2,10,000-₹2,15,000 support zone back in play.
- Q2 2026 gold demand data (late July): The WGC’s Q2 Gold Demand Trends report is due later in the month. Q1 saw record central bank buying (244 tonnes) and elevated bar-and-coin demand. Q2 data will show whether the structural physical bid has held through the rate-and-oil repricing or whether it has softened.
Disclaimer: This article is for informational purposes only and does not constitute investment or trading advice. All prices are futures closing prices, MCX in INR, COMEX in USD. Views attributed to Colin Shah of Kama Jewelry are drawn from a public perspective note. Past performance is not indicative of future results.
Authored by Dhawal Chotai