

Macro Snapshot: Three events defined the week ending June 19, and they pointed in different directions. On Monday June 15, news emerged that US and Iranian negotiators had agreed a memorandum of understanding with formal signing scheduled for June 19 in Switzerland; oil declined to a two-month low on the announcement, with Brent falling below $80 per barrel after losing roughly 15% over four sessions. On Tuesday June 16, the World Gold Council released its Central Banks Gold Reserves Survey 2026, the most consequential structural data point for the gold market in the calendar. On Wednesday June 17, the FOMC concluded Kevin Warsh’s first meeting as Chair with a hawkish hold: rates held at 3.50% to 3.75% by a unanimous 12-0 vote, but the dot plot raised the 2026 median to 3.8% (up from 3.4% in March), implying at least one rate hike. Nine of 18 participants now project at least one hike before year-end; one participant (likely Warsh, who confirmed he did not submit a dot) was absent.
The FOMC also stripped its statement to 130 words, removed dovish forward guidance language, and raised its 2026 PCE inflation forecast to 3.6% (from 2.7%). Markets reacted sharply: CME FedWatch shifted to roughly 66% probability of at least one hike by December, gold whipsawed $163 intraday on COMEX (from $4,382 pre-decision to $4,219 before partially recovering), and the US 2-year Treasury yield rose 12 basis points. The dollar strengthened intraday on the hawkish projections, but the broader weekly picture for the dollar remained mixed because the Iran peace MOU and lower oil prices were softening the inflation outlook from a different angle. The rupee strengthened progressively through the first four trading days, reaching a six-week high near 94.2 ahead of the FOMC announcement, supported by a sharp decline in oil prices (Brent below $80 per barrel) and improved foreign exchange flows. Some of those gains were given back on the FOMC-driven dollar bid on Friday, but the rupee still closed the week ending June 19 approximately 0.5% stronger against the dollar than the prior week. The net rupee strengthening added to the international price decline rather than absorbing it in MCX terms.
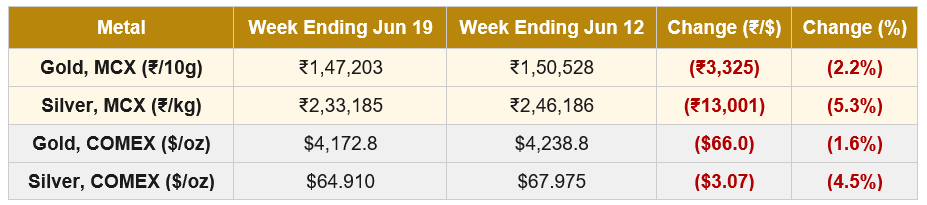
Gold-specific drivers: The WGC Central Banks Gold Reserves Survey 2026, released on June 16, confirmed that the structural institutional bid under the gold market is strengthening, not weakening. 89% of reserve managers expect global central bank gold holdings to increase over the next 12 months, and a record 45% expect to increase their own institution’s gold holdings (up from 43% in 2025). 93% of respondents now hold gold (up from 81% in 2025), a sharp jump in just one year. 83% believe gold will account for a higher share of total reserves in five years (up from 76%). Notably, 74% expect the US dollar’s share of global reserves to be lower in five years. The Financial Times reported during the week that gold has overtaken US government bonds as the top reserve asset, according to the ECB. The hawkish FOMC complicates this picture on a short-term horizon: higher real yields raise the opportunity cost of holding non-yielding gold, and the dollar rally caps upside in dollar terms. The Iran peace MOU removed a portion of the safe-haven premium that had supported gold through the spring. For Indian holders, the rupee strengthening of approximately 0.5% added to the international decline rather than cushioning it. MCX gold fell 2.2% against COMEX’s 1.6% for that reason.
Silver-specific drivers: Silver fell harder than gold both internationally (4.5% versus 1.6%) and domestically (5.3% versus 2.2%). The monetary engine, which had absorbed the hawkish FOMC repricing, was joined by the industrial engine, which absorbed the implications of lower oil prices and the rate-induced dollar strength. The Silver Institute’s World Silver Survey 2026 deficit story (46.3 Moz for 2026) remains structurally intact, but cyclical industrial demand expectations are now in question as oil prices fall and the Fed signals a higher-for-longer policy stance. The gold-silver ratio continued to widen, reflecting silver’s higher sensitivity to rate-cycle repricing and to industrial demand concerns. Silver remains the more impulsive metal in both directions; the FOMC reaction saw silver fall sharply and then recover nearly 70% of the loss within a single session, a pattern consistent with thin liquidity at price extremes rather than structural change.
Gold | MCX GOLD1!
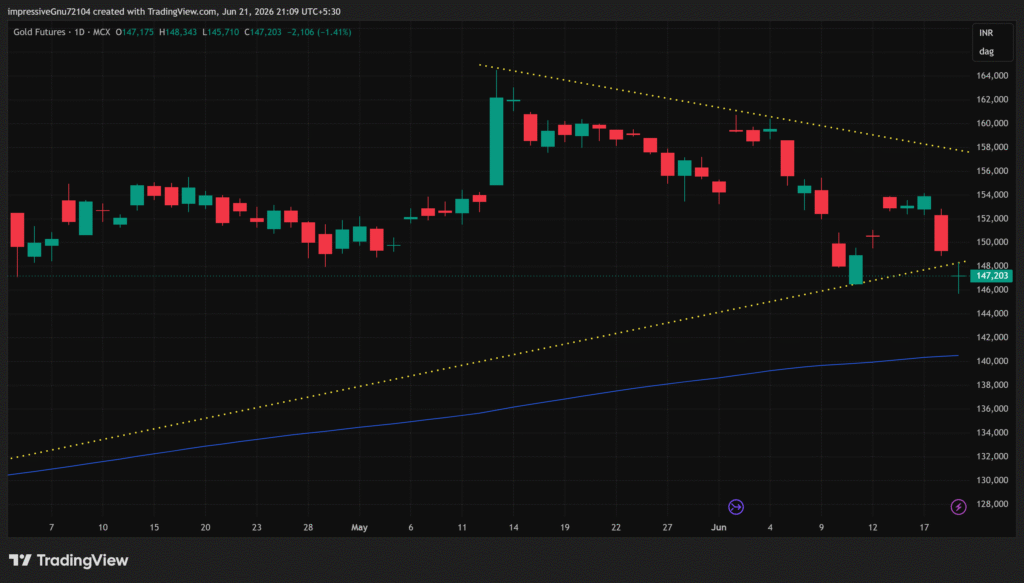
The recent bounce into 1,53,000 to 1,54,000 failed decisively. That was the key tell of the week: price attempted to recover from lower demand, but sellers absorbed the move before price could reclaim the prior support shelf. The failure at that level shifted the market structure from corrective to early-breakdown character.
Price then pushed back into and slightly through the lower rising yellow trendline that had supported the broader uptrend since the February lows. This means the compression pattern is no longer cleanly intact; the lower boundary is damaged. The most recent candle shows a lower-wick reaction from around 1,45,700, but the reaction is weak because price did not reclaim the broken lower trendline or the 1,48,500 to 1,50,000 area with authority. The lower-high sequence under the descending trendline continues, and price is now probing below the prior reaction low area.
Pattern status: weakening into early breakdown. It is not a strong confirmed breakdown yet because there is no decisive downside expansion below 1,45,700, but it is also no longer fair to call price safely inside the broader pattern. The rising trendline that defined the structural bull case since February has been undercut. The next levels of structural significance are the 200 EMA near ₹1,40,500 and the April lows in the ₹1,38,000 to ₹1,40,000 range. A reclaim of 1,48,500 to 1,50,000 would reduce immediate downside pressure; failure below 1,45,700 would confirm the breakdown more cleanly.
| Key Takeaway: Gold is in an early breakdown after failing at ₹1,53,000 to ₹1,54,000 and undercutting the lower rising trendline that supported the broader uptrend since February. The latest lower-wick reaction from ₹1,45,700 shows demand at the edge of the structure, but acceptance is missing. A reclaim of ₹1,48,500 to ₹1,50,000 would relieve immediate pressure; a clean close below ₹1,45,700 would confirm the structural breakdown. For Indian market participants, the rupee added to the loss rather than absorbing it for the second consecutive week: MCX gold fell 2.2% versus COMEX’s 1.6%. The duty-and-rupee cushion that defined the post-May-13 market is no longer reliable on a week-to-week basis. |
Silver | MCX SILVER1!
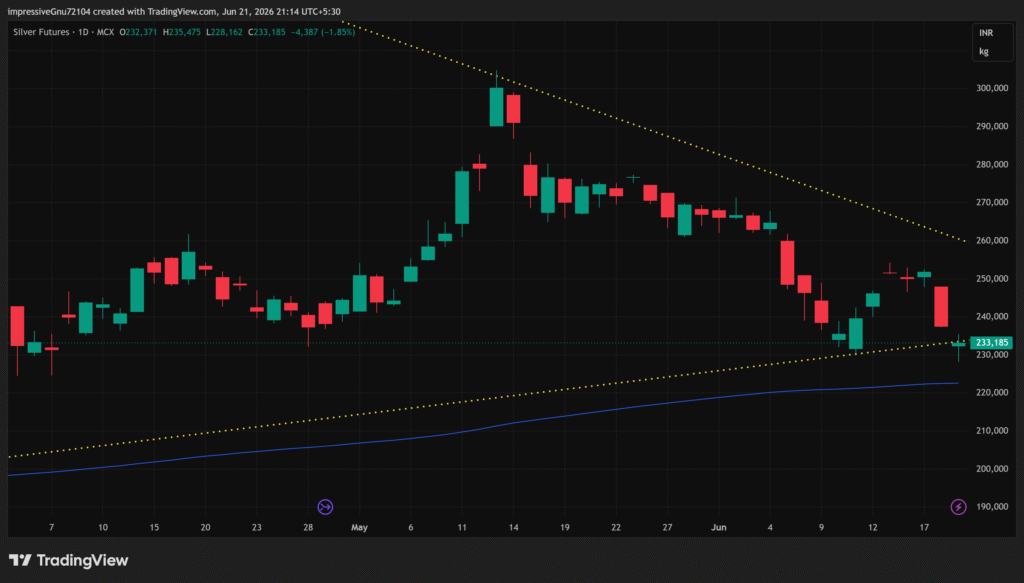
Silver’s rebound attempt into 2,48,000 to 2,52,000 failed clearly. That area is now active supply: price could not accept above it, and the rejection produced another sharp leg lower. The latest action is bearish in direction but technically incomplete: price undercut the lower rising trendline and swept toward 2,28,000 before closing back near 2,33,000. That lower wick shows a more visible demand reaction than gold produced, but the close did not reclaim the broken trendline.
The structural picture remains weak. The May spike above 3,00,000 failed completely. Price formed lower highs under the descending trendline, lost the 2,60,000 to 2,65,000 support shelf, failed again near 2,50,000, and then undercut the rising trendline. The lower-wick reaction in the latest session does not repair that sequence; it indicates that demand exists at lower levels, but supply has been winning every test of overhead resistance.
Pattern status: the compression has weakened into early breakdown. The lower rising trendline is now damaged, but the latest candle did not close with strong bearish expansion underneath it. This is more accurately described as a breakdown attempt or undercut rather than a fully clean confirmed breakdown. It becomes a confirmed breakdown only if price accepts below 2,28,000 to 2,33,000. A reclaim above 2,40,000, then 2,48,000 to 2,52,000, would suggest the lower-bound breakdown is failing. The next structural support below current levels is the 200 EMA near ₹2,22,000.
| Key Takeaway: Silver is in an early breakdown after failing at ₹2,48,000 to ₹2,52,000 and undercutting the lower rising trendline. The latest lower-wick reaction from ₹2,28,000 means the breakdown is not fully confirmed yet, but bias remains bearish while price holds below ₹2,40,000 to ₹2,52,000. The gold-silver ratio continued to widen, reflecting silver’s greater sensitivity to the rate-and-oil repricing of the week ending June 19. The structural deficit thesis from the World Silver Survey 2026 remains intact, but tactical patience continues to make more sense than tactical aggression. |
Special Focus | The 2026 Central Bank Gold Survey:
The World Gold Council released its annual Central Banks Gold Reserves Survey on June 16, the most consequential structural data point for the gold market published in 2026 so far. The findings deserve attention because they sit in direct contrast to the price action of the week ending June 19, and because they describe the institutional foundation under the cyclical noise.
Demand expectations at a record: A record 45% of reserve managers expect to increase their own institution’s gold holdings over the next 12 months, up from 43% in 2025 and 29% in 2024. 89% expect global central bank gold holdings to increase. 83% believe gold will account for a higher share of total reserves in five years, up from 76% in 2025. 93% of respondents now hold gold, a sharp jump from 81% the previous year. Concurrently, 74% expect the US dollar’s share of global reserves to be lower in five years, a continuation of the de-dollarisation trend that has been visible in central bank data for several years.
Why central banks hold gold has shifted: A record 90% of respondents cited gold’s performance during times of crisis as a reason to hold the metal. Long-term store of value (84%) and portfolio diversification (82%) rounded out the top three motivations. Among emerging market and developing economy respondents, 85% cited gold’s role as a geopolitical risk hedge. The proportion citing historical legacy as a reason fell to 46%, down from 62% in 2025, a meaningful shift: central banks increasingly view gold as an active strategic allocation rather than an inherited reserve component. Storage patterns are changing in parallel: 9% increased domestic storage over the prior 12-month period (up from 5%), and 10% diversified overseas storage locations (up from 2%). The Bank of England remains the most popular vaulting location at 57%.
The Treasury comparison: Separately during the week ending June 19, the Financial Times reported that gold has overtaken US government bonds as the top reserve asset, according to the European Central Bank. The combination of survey expectations and the ECB observation underlines the same story from two angles: the institutional bid for gold is broadening, deepening, and increasingly motivated by strategic rather than legacy considerations. The cyclical correction visible on the price chart and the structural strengthening visible in central bank behaviour are running on different clocks. Both are real.
Source: World Gold Council Central Banks Gold Reserves Survey 2026 (released 16 June 2026). The research was conducted by the WGC in partnership with YouGov between 5 February and 19 May 2026, with 76 responses from central banks, a record sample. Used in line with fair industry practice with citation to the World Gold Council as source.
Watch in the Days Ahead:
- US May Core PCE (June 25): The Fed’s preferred inflation gauge. Core PCE in April was 3.3% year-on-year. A May print at or above the Fed’s revised year-end PCE forecast of 3.6% would make the nine hawkish dots look like a floor, not a ceiling. A softer print would weaken the 2026 hike case and ease pressure on precious metals.
- Iran peace deal implementation: The MOU was scheduled for formal signing on June 19 in Switzerland. The signing itself is a single event; the implementation is a multi-month process. Any delay, walk-back, or rupture in the deal would re-introduce the geopolitical risk premium into gold and oil. Smooth implementation would extend the recent oil decline and further weaken gold’s safe-haven bid.
- Gold at the lower trendline and ₹1,45,700: This is the structural line for the broader bull case in MCX gold. A reclaim of ₹1,48,500 to ₹1,50,000 would suggest the breakdown is failing. A close below ₹1,45,700 would confirm it and open the path toward the 200 EMA at ₹1,40,500 and the prior April lows.
- Silver at ₹2,28,000 to ₹2,33,000: The lower-wick reaction zone. Acceptance below this level (a clean close below 2,28,000) would confirm the breakdown. A reclaim of ₹2,40,000 would suggest the breakdown is failing.
- Rupee direction and FII flows: The rupee strengthened approximately 0.5% in the week ending June 19, driven by lower oil prices and improved capital flows. If this trend continues, MCX precious metals prices will continue to absorb both the international decline and the currency strength. If the rupee reverses, the duty-and-rupee cushion may begin to absorb international moves again.
- Warsh’s task forces: The new Fed Chair announced five task forces to review communications, balance sheet, productivity, labour market, and inflation. Most are expected to conclude by year-end. The communication overhaul, in particular, will affect how markets price forward expectations, which is structurally relevant for gold.
Disclaimer: This article is for informational purposes only and does not constitute investment or trading advice. All prices are futures closing prices, MCX in INR, COMEX in USD. The Special Focus section draws on data from the World Gold Council Central Banks Gold Reserves Survey 2026 (released 16 June 2026), used in line with fair industry practice with citation to the World Gold Council as source. Past performance is not indicative of future results.
Authored by Dhawal Chotai
