

Macro Snapshot: The week ending May 1 was dominated by Powell’s final FOMC meeting on April 28-29, which delivered the headline outcome markets expected — a hold at 3.50-3.75% — but with a far more contentious internal split than anticipated. The committee voted 8-4 to hold (some sources reported 11-1, but the dissent count of four is firmer), with Stephen Miran preferring an immediate quarter-point cut and three others — Hammack, Kashkari, Logan — supporting the hold but opposing the inclusion of an easing bias in the statement. This is the most fractured Fed in years, and it sets up a difficult handover. Powell confirmed he will step down as chair when his term expires May 15 but remain on the board as a governor. Kevin Warsh’s Senate confirmation is now expected to wrap up before his first meeting in June.
| Metal | Week Ending May 1 | Week Ending Apr 24 | Change (₹/$) | Change (%) |
| Gold-MCX (₹/10g) | ₹1,51,352 | ₹1,52,699 | −₹1,347 | −0.9% |
| Silver-MCX (₹/kg) | ₹2,50,937 | ₹2,44,636 | +₹6,301 | +2.6% |
| Gold-COMEX ($/oz) | $4,644.5 | $4,740.9 | −$96.4 | −2.0% |
| Silver-COMEX ($/oz) | $76.43 | $76.42 | +$0.02 | +0.0% |
Note: All prices are Friday May 1 futures closing prices. MCX prices in INR, COMEX prices in USD. Note the divergence over the week — silver gained while gold fell, and COMEX gold fell more than MCX gold as rupee weakness cushioned domestic prices.
For precious metals, the policy meeting itself was a non-event in the short term — gold pulled back modestly while silver held flat in dollar terms. The bigger story is what comes next: Warsh has publicly indicated openness to cutting rates soon, and his proposals to limit forward guidance and prioritize new data sources represent a structural shift in how the Fed will communicate. The 17-day gap between Powell’s final meeting and Warsh’s first decision creates uncertainty that historically benefits gold through safe-haven demand. The dissent in the April 29 vote signals that Warsh will inherit a divided committee — his ability to foster consensus on cuts will be tested immediately.
The Hormuz situation continues to grind on with no resolution. Iran has kept the strait largely blocked since late February, and the US blockade of Iranian ports since April 13 has created a ‘dual blockade’ configuration. Trump has threatened wider strikes against Iranian infrastructure if no deal is reached. Oil is hovering around $106-110 per barrel — elevated, but not at the $150-200 levels analysts initially predicted, with strategic petroleum reserve releases and pre-war tanker inventories absorbing some of the disruption. Exxon’s CEO warned Friday that the market ‘has not seen the full impact’ yet, signalling that further upside in oil and inflation pressure remains a real risk.
For India specifically, two structural factors remain at play. First, the rupee at around ₹94 per dollar continues to act as a price cushion — COMEX gold fell 2.0% in dollar terms over the week while MCX gold fell only 0.9% in rupee terms. Second, India is now buying significantly more Russian crude as Middle East flows have been disrupted, which is reshaping the country’s energy import mix. The structural supply tightness in the gold market continues, with imports having hit a 9-month low in March. None of this has gone away just because prices have pulled back.
Gold I MCX Gold1:
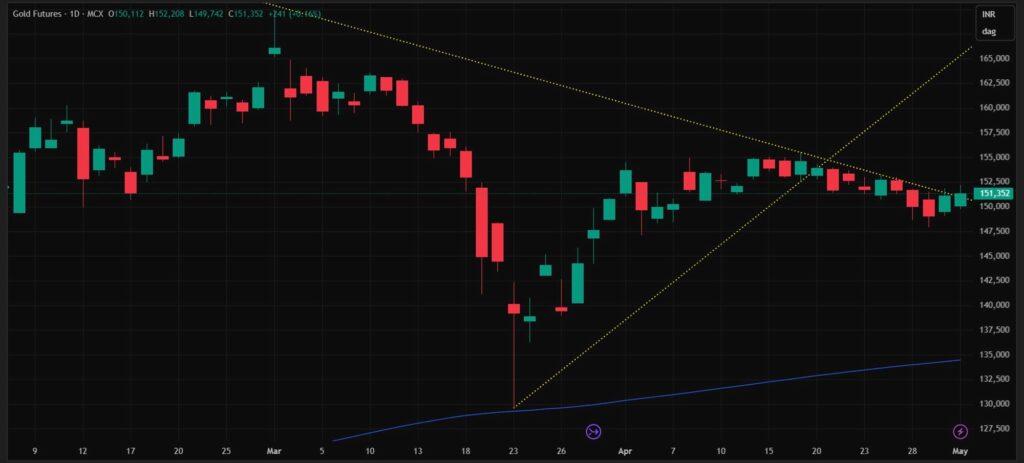
MCX Close (May 1): ₹1,51,352 per 10g Prior week (Apr 24): ₹1,52,699 Change: −₹1,347 (−0.9%) | ATH: ₹1,80,779 200 EMA: ~₹1,33,500
Following the triangle breakdown the previous week, gold continued drifting lower through Monday to Wednesday (Apr 27-29), marking a fresh swing low at approximately ₹1,49,700 on Wednesday. Through these sessions, price stayed close to the falling trendline that had served as the upper boundary of the broken triangle — the trendline now acting as dynamic resistance from above, capping every minor upward attempt.
The shift came on Thursday and Friday. Demand emerged at the ₹1,49,700-1,50,000 zone, and Friday’s close at ₹1,51,352 sits marginally above the falling trendline — a tentative but meaningful first sign that the short-term bearish move is exhausting. This is one candle of evidence, not a confirmed reversal. The earlier higher-low structure from the late-March base remains broken, and a single close above a trendline does not yet establish a new uptrend. But it does suggest that buyers are no longer absent at these levels.
The 200 EMA at approximately ₹1,33,500 remains a distant structural floor, confirming that the long-term uptrend is intact despite the recent correction. The gap between current price and the 200 EMA — roughly 13% — is healthy for a metal that ran from ₹95,000 to ₹1,80,779 over the past 18 months. This is a corrective phase within a structurally bullish market, not a trend reversal.
| Key Takeaway: Gold is showing early signs that the bearish drift is exhausting, with Friday’s close marginally reclaiming the falling trendline. For jewellers, the ₹1,50,000 zone has now held twice as a demand area — this is the level to watch. A daily close back above ₹1,52,500 in the days ahead would shift the bias from neutral to mildly bullish. Failure to hold the trendline reclaim and a return below ₹1,50,500 would resume the bearish move toward ₹1,47,500-1,48,000. Procurement bias: cautious accumulation in the ₹1,50,000-1,51,500 zone makes more sense than chasing strength. |
Silver I MCX Silver1:
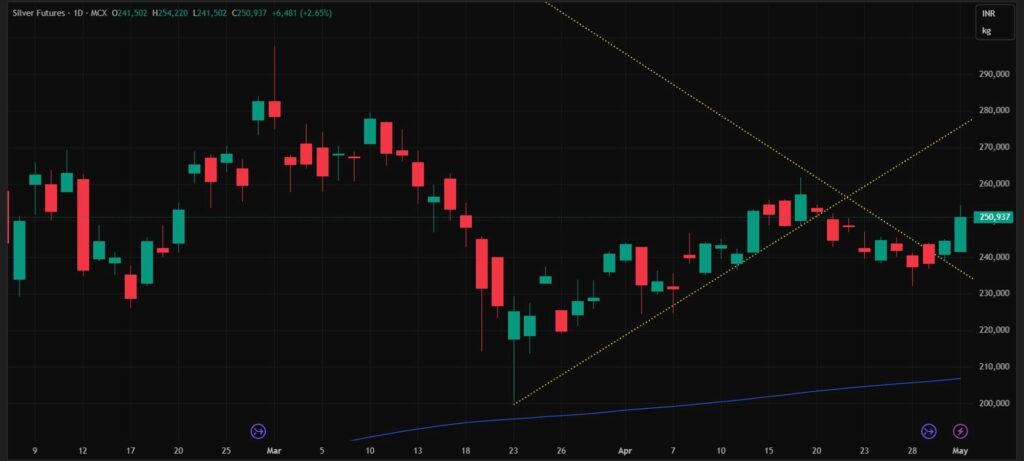
MCX Close (May 1): ₹2,50,937 per kg Prior week (Apr 24): ₹2,44,636 Change: +₹6,301 (+2.6%) | ATH: ₹4,20,048 200 EMA: ~₹2,03,500
Silver’s chart tells a cleaner reversal story than gold’s. Following the triangle breakdown the previous week, silver continued lower through Monday-Wednesday (Apr 27-29), marking a swing low around ₹2,35,000-2,37,000 in line with gold’s bearish drift. The break came earlier and harder for silver: price moved decisively above the falling trendline on Thursday Apr 30, and Friday May 1 saw a sharp upmove with a strong bullish bar closing at ₹2,50,937, up 2.65% on the session.
This is meaningfully different from gold’s behaviour. Silver did not drift back toward the trendline and barely close above it — it pushed through with conviction and added a sharp follow-through candle on the next session. The deeper demand zone at ₹2,20,000-2,25,000 was not retested, with the recent low holding well above it. The ₹2,52,000-2,55,000 area is now the immediate supply zone where the broken trendline likely transitions to overhead resistance.
Silver’s outperformance also shows up in the gold-silver ratio, which compressed sharply over the week as silver gained while gold fell. This is consistent with silver’s dual nature as both safe-haven and industrial metal — in relief moves, silver’s industrial demand angle adds leverage to the upside that pure safe-haven assets cannot match. The 200 EMA at approximately ₹2,03,500 is well below current prices, confirming the long-term uptrend is intact.
| Key Takeaway: Silver’s reversal signal is cleaner and earlier than gold’s — Thursday’s trendline reclaim and Friday’s sharp upmove suggest the short-term bearishness has likely ended. A clean break above ₹2,55,000 in the days ahead would confirm the reversal and open the path toward ₹2,65,000-2,70,000. A sharp pullback below ₹2,47,000 would invalidate the setup and resume the bearish structure. For trade participants, silver’s faster movement in both directions remains a reminder: the same structure that delivered 2.6% can take it back just as quickly. Position sizing relative to volatility matters more for silver than for gold. |
Demand Backdrop | World Gold Council Q1 2026 Data:
The World Gold Council’s Gold Demand Trends report for Q1 2026, released April 29, provides crucial structural context for the price action the trade is navigating. The headline number: total global gold demand reached 1,231 tonnes in Q1, up 2% year-on-year, but the value of that demand surged 74% year-on-year to a record $193 billion. The volume number is unremarkable; the value number is the story.
The structural shift — investment is now eating jewellery’s lunch. Global jewellery demand fell 23% year-on-year to 300 tonnes, the lowest quarterly figure since the COVID-affected Q2 2020. Bar and coin demand, meanwhile, rose 42% to 474 tonnes — the second-highest quarter on record. China’s bar and coin demand surged 67% to a record 207 tonnes, smashing the previous Q2 2013 record. This is no longer a price story — it is a structural shift in how gold is being held, and it has direct implications for jewellery retailers and manufacturers in the gems and jewellery trade.
India’s Q1 — volumes resilient, values record. Indian gold demand rose 10% year-on-year to 150.6 tonnes, with the value of demand nearly doubling to ₹2,27,530 crores, up 99% year-on-year. Jewellery volumes fell 19% to 66.1 tonnes, but jewellery value reached a record ₹99,920 crores — up 47% year-on-year. The takeaway for the trade: Indian consumers are not abandoning gold jewellery, they are spending more on smaller, lighter pieces. The exchange of old gold for new accounted for 40-60% of transactions across major retailers.
Listed jeweller performance reflects this resilience. Major listed retailers reported revenue growth of 32% to 124% year-on-year in Q1 — the best quarter of the financial year for several. Higher ticket sizes, plain gold jewellery traction, sharp rises in coin sales, and rapid growth in digital channels all contributed. Retailers added 7-38 stores during the quarter despite some launch delays from geopolitical supply disruptions. The trade is expanding into the elevated price environment, not retreating from it.
The investment shift in India is dramatic. Bar and coin demand rose 34% year-on-year to 62.3 tonnes — the highest first quarter since 2013 — and now nearly matches jewellery volumes (66.1 tonnes). Indian gold ETF demand jumped 197% year-on-year to a record 19.9 tonnes, with January alone accounting for nearly 80% of quarterly inflows. Investment demand has overtaken jewellery in the demand mix for the first time, rising to 55% of total domestic demand against jewellery’s 44%. This is a structural inflection point worth watching.
Supply-side context. Indian gold imports hit 196.4 tonnes in Q1, up 39% year-on-year, but flow disruptions emerged in March as Middle East tensions affected the UAE transit route — a key channel for Indian bullion imports. Recycling rose 20% to 31.2 tonnes, but remains muted versus what an 81% rise in domestic prices would historically generate. Holders are choosing to monetise via gold-backed loans rather than liquidate — outstanding retail bank loans against gold jewellery reached ₹4.3 trillion (~$47 billion) by end-February, up 124% year-on-year. This is a structural floor under physical demand.
Central bank buying remains intact. Global central banks added 244 tonnes to reserves in Q1, up 17% quarter-on-quarter despite an uptick in tactical selling by Turkey, Russia and Azerbaijan’s SOFAZ. Poland led net buying with 31 tonnes, Uzbekistan added 25 tonnes, and the People’s Bank of China added 7 tonnes — more than doubling its previous quarter’s purchase. The RBI’s gold reserves remained nearly steady at around 880 tonnes, but gold’s share of total forex reserves rose to 17% from 12% a year ago, reflecting valuation gains. Central bank demand is structural, not cyclical, and continues to underpin global prices.
WGC outlook for India 2026: 650-750 tonnes. The Council’s full-year demand projection for India is 650-750 tonnes — meaningful given that elevated prices are creating affordability headwinds for mass-market jewellery while supporting investment demand. The summer wedding season and regional festivals are expected to provide support, building on the momentum seen during Akshaya Tritiya. The structural message: gold’s role in India is shifting from primarily ornamental to increasingly investment-driven, and this shift will likely continue.
Source: World Gold Council, Gold Demand Trends Q1 2026 and India Gold Demand Trends Q1 2026, both published April 29, 2026. Used in line with fair industry practice with citation to the World Gold Council as source.
Watch in the Days Ahead:
- Trendline confirmation: The single most important technical question for the days ahead: do both metals hold their trendline reclaims? Gold’s reclaim is marginal and needs follow-through. Silver’s is more decisive but still needs confirmation. Watch the first two trading sessions closely — if both metals hold above the trendline through Tuesday’s close, the reversal is real. If either fails, the bearish move resumes.
- Hormuz and oil: Iran has kept the strait largely blocked, the US blockade of Iranian ports continues, and Trump has threatened wider strikes. Exxon’s CEO warned Friday that oil markets have not yet absorbed the full supply disruption. Any sharp move in oil — in either direction — will move gold and silver immediately. A breakthrough in talks pulls oil and metals lower together. A breakdown into wider conflict pushes oil higher and metals higher with it.
- US data calendar: Q1 2026 GDP came in last week and the Atlanta Fed’s GDPNow had been tracking just 1.24% growth. Watch for any further confirmation of slowing US growth — combined with elevated inflation, this is the textbook stagflation backdrop that has historically been positive for gold. Initial jobless claims and PCE inflation data due in the days ahead.
- Fed leadership transition: Powell’s term as chair ends May 15. Warsh’s Senate confirmation is expected to wrap up before then. Any Warsh communication or testimony that signals dovish policy intent would be sharply positive for gold. The 17-day gap between Powell’s final meeting and Warsh’s first FOMC in June creates a vacuum that historically favours precious metals.
- MCX key levels: Gold: ₹1,52,500 reclaim (bullish trigger), ₹1,50,000 demand (must hold), ₹1,47,500 (next downside target if support breaks). Silver: ₹2,55,000 breakout (bullish confirmation), ₹2,47,000 invalidation (bearish if breached), ₹2,35,000 (recent low to retest if reversal fails).
Disclaimer: This article is for informational purposes only and does not constitute investment or trading advice. All prices are futures closing prices — MCX in INR, COMEX in USD. Past performance is not indicative of future results. Demand Backdrop section draws on data from the World Gold Council Gold Demand Trends Q1 2026 and India Gold Demand Trends Q1 2026, used in line with fair industry practice with citation to the World Gold Council as source.
Authored by Dhawal Chotai
